Key Methods in Geography
Chapter 6: Fundamentals of Mapping and GIS
Surfers helped clean up California oil spill with mapping app

Economic growth in eastern Ohio can be seen contrasted with the economic decline of eastern rural Kentucky

Interpreting this map of accidents and average annual daily traffic might be more challenging to determine which areas show statistically more significant accident rates, but these maps help planners design safer crosswalks and streets and help community members be more safety-aware

Consider this GIS map showing the deadliest and most intense earthquakes in recorded history. Think of the ‘G’ as the map of the earthquakes, the table containing the earthquake data as the ‘I’ part and the ‘S’ means that you can select an earthquake on the map or in the table.

Relationship map showing per cent smokers and per cent excessive drinking, by county in the USA

3D hex-bin extrusions showing hot spots of accidents in a county in Florida using Esri GIS software

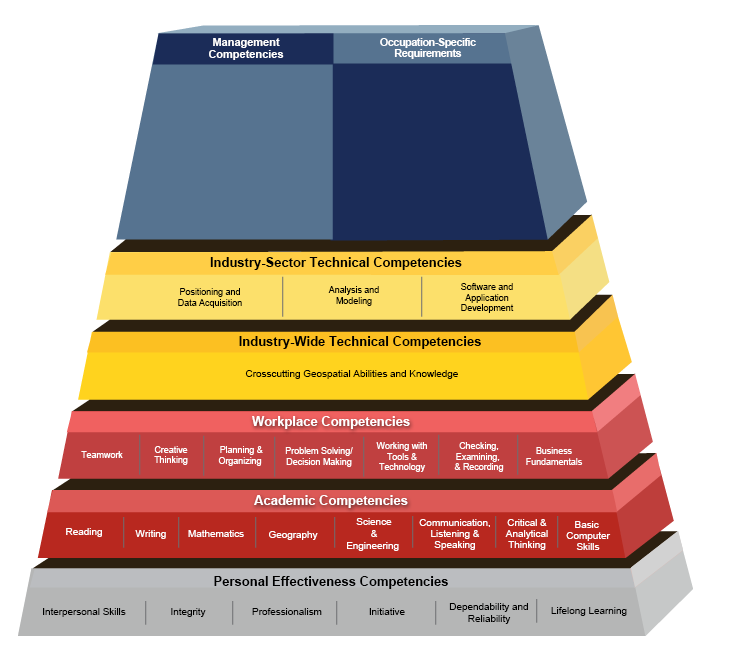
The geospatial technology competency model: Note the personal competencies that are important in success with GIS, and ask yourself: ‘Am I organized? Am I ethical? Can I work with data?’ Consider one area of the GTCM that you would like to work on