Chapter 10: Comparing Two or More Means by Analysing Variances: ANOVA
1. Which of the following is a pooled variance estimate that constitutes the denominator of an F-ratio? [TY10.1]
- The between-cells mean square (MSB).
- The mean of the sampling distribution.
- The sum of the deviations from the grand mean.
- The grand mean.
- The within-cells mean square (MSW).
2. Which of the following statements is true? [TY10.2]
- In one-way ANOVA the total sum of squares comprises two main sources of variance: within-groups variance and between-groups variance. Each has the same number of degrees of freedom.
- In one-way ANOVA the total sum of squares comprises two main sources of variance: within-groups variance and between-groups variance. Each has its own number of degrees of freedom.
- In one-way ANOVA the total sum of squares comprises three main sources of variance: within-groups variance, between-groups variance and error variance. Each has the same number of degrees of freedom.
- In one-way ANOVA the total sum of squares comprises three main sources of variance: within-groups variance, between-groups variance and information variance. Each has the same number of degrees of freedom.
- In one-way ANOVA the total sum of squares comprises three main sources of variance: within-groups variance, between-groups variance and information variance. Each has its own number of degrees of freedom.
3. What is the point of calculating the value of η2 in relation to particular F- and p-values? [TY10.2]
- η2 is a hypothesis-testing measure that can tell us whether a particular F-value is significant.
- η2 is the square of α and can tell us whether a particular p-value is significant.
- η2 is a measure of effect size that can tell us whether a particular F-value is significant.
- η2 is a measure of effect size that can tell us whether a particular p-value is significant.
- η2 is a measure of effect size that can tell us how much variance a particular effect accounts for.
4. A researcher, Isobel, conducts one-way analysis of variance in which she compares the final marks of students who have studied psychology at one of five different institutions, A, B, C, D and E. The study looks at the marks of 100 students, 20 from each institution. On the basis of a given theory, the researcher plans to make four comparisons: between A and B, A and C, C and D, and C and E. Three other researchers make the following observations:
X: ‘If Isobel used an experimentwise alpha level of .01, a Bonferroni adjustment would mean that each of these tests had an alpha level of .0025.’
Y: ‘If Isobel used an experimentwise alpha level of .05, a Bonferroni adjustment would mean that each of these tests had an alpha level of.0025.’
Z: ‘If Isobel used an experimentwise alpha level of .05, a Bonferroni adjustment would mean that each of these tests had an alpha level of .0125.’
Who is correct? [TY10.4]
- Only X.
- Only Y.
- Only Z.
- X and Y.
- X and Z.
5. An experimental psychologist conducts a study examining whether the speed with which two shapes can be identified as similar or different depends on whether the stimuli are (a) of equal or unequal size and (b) symmetrical or asymmetrical. The mean reaction times for the four cells of the design are as follows: equal symmetrical (M = 132 ms), unequal symmetrical (M = 148 ms), unequal asymmetrical (M = 142 ms), unequal asymmetrical (M = 182 ms). Which of the following is true? [TY10.5]
- A line graph in which these data are plotted suggests that there might only be a main effect for size.
- A line graph in which these data are plotted suggests that there might only be a main effect for symmetry.
- A line graph in which these data are plotted suggests that there might only be a main effect for size and an interaction between size and symmetry.
- A line graph in which these data are plotted suggests that there might only be a main effect for symmetry and an interaction between size and symmetry.
- A line graph in which these data are plotted suggests that there might be main effects for size and symmetry and an interaction between size and symmetry.
6. Which of the following statements is false? [TY10.6]
- One difference between ANOVA and t-tests is that ANOVA allows researchers to compare responses of more than two groups.
- One difference between ANOVA and t-tests is that ANOVA does not make assumptions about homogeneity, normality and independence.
- One difference between ANOVA and t-tests is that ANOVA can be used to examine simultaneously the impact of more than one variable.
- One difference between ANOVA and t-tests is that ANOVA is based on analysis of the ratios of variances.
- One difference between ANOVA and t-tests is that ANOVA uses two separate degrees of freedom (one for between-cells variance, one for within-cells variance).
7. A researcher conducts a study examining the impact of social support on depression in which he studies how four independent groups that each receive a different type of social support (financial, emotional, intellectual, none) react to a stressful experience. There are 20 people in each group. Which of the following statements is true? [TY10.7]
- There are 4 degrees of freedom for the between-cells variance.
- There are 78 degrees of freedom for the within-cells variance.
- If ANOVA yielded a between-groups F-value of −2.18 this would be significant with alpha set at .05.
- If ANOVA yielded a between-groups F-value of 0.98 this would be significant with alpha set at .01.
- None of the above statements is true.
8. Which of the following statements about the F-distribution is false? [TY10.8]
- The distribution is asymmetrical.
- The distribution is one-tailed.
- Higher values of F are associated with a higher probability value.
- The distribution is positively skewed.
- If the amount of between-cells variance is equal to the amount of within-subjects variance, the value of F will be 1.00.
9. The SPSS ANOVA output below is from a study in which participants were randomly assigned to one of four conditions in which they were given different instructions to encourage them to continue. Which of the following statements is true?

- There is no possibility at all that the results are due to chance.
- It would be useful to supplement the p-value with a measure of effect size.
- With an alpha level of .01, ANOVA reveals a significant effect for Instruction.
- As groups are randomly assigned, we need to compute a z-score in order to gauge the size of these effects relative to chance.
- Both (a) and (b).
10. The SPSS ANOVA output below is from a study in which participants were randomly assigned to one of four conditions in which they were given different instructions to encourage them to continue. Which of the following statements is true?
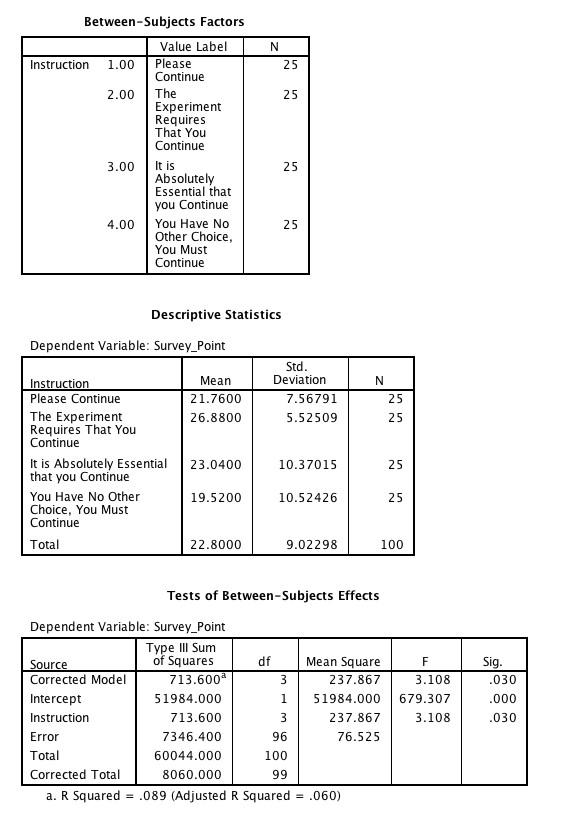
- ANOVA shows that there was no effect for Instruction.
- With an alpha level of .05, ANOVA reveals a significant effect for the Instruction.
- With an alpha level of .01, ANOVA reveals a significant effect for Instruction.
- With an alpha level of .05, ANOVA reveals a significant effect for Intercept.
- With an alpha level of .01, ANOVA reveals a significant effect for Intercept.
11. “A hypothetical model in which mean responses differ across the conditions of an experimental design. This represents an alternative to the null hypothesis that the mean response is the same in all conditions.” What is this a glossary definition of?
- Hypothetical model.
- Hypothetical difference model.
- Difference model.
- Effects model.
- Experimental model.
12. “Comparisons between every pair of cells in a given experimental design”. What is this a glossary definition of?
- cross-lagged comparisons
- pared comparisons
- pairwise comparisons
- a priori comparisons
- post hoc comparisons
13. “Effects which reflect the impact of one independent variable averaged across all levels of other independent variables, rather than the impact of an interaction between two or more independent variables.” What is is this a glossary definition of?
- Main effects.
- Average effects.
- Significant effects.
- Non-interaction effects.
- Isolation effects.