Research Methods and Statistics in Psychology
Student Resources
Chapter 8: Examining Differences between Means: The t-test
1. Which of the following statements is/are true about the t-distribution? [TY8.1]
- Its shape changes with the number of degrees of freedom.
- Its expected value is 0.
- It can be used to test differences between means providing that the population standard deviation is known.
- Both (a) and (b).
- All of the above.
Answer: D
2. The mean height of a sample of 100 men in 2014 is 180 cm, with a standard deviation of 10 cm. The mean for the same population in 1914 was 170 cm. Imagine that we want to use the 2014 sample to test whether the height of the population has changed over the intervening 100 years. Which of the following statements is true? [TY8.2]
- The number of degrees of freedom for the test in this case is 99.
- The t-value is 10.0.
- The t-value corresponds to a very small probability that a random process of taking samples of 100 men from a population similar to the 1914 population would produce a sample of 180 cm or taller.
- All of the above.
- Answers (a) and (b) only.
Answer: D
3. Which of the following is not relevant to a between-subjects t-test? [TY8.3]
- The pooled variance estimate.
- A difference score D.
- An information term.
- A sampling distribution of the differences between means.
- A probability that a difference of the same size or larger could be obtained by a random process.
Answer: B
4. If an experimenter conducts a t-test to see whether the responses of participants in a control group differ from those of an experimental group, which of the following outcomes will yield the highest t-value? [TY8.4]
- If there are 10 participants in each condition and the difference between the mean responses of the control group and the experimental group is 2 and both have standard deviations of 1.
- If there are 10 participants in each condition and the difference between the mean responses of the control group and the experimental group is 2 and both have standard deviations of 2.
- If there are 20 participants in each condition and the difference between the mean responses of the control group and the experimental group is 1 and both have standard deviations of 1.
- If there are 20 participants in each condition and the difference between the mean responses of the control group and the experimental group is 2 and both have standard deviations of 1.
- If there are 20 participants in each condition and the difference between the mean responses of the control group and the experimental group is 2 and both have standard deviations of 2.
Answer: D
5. Which of the following must be true of a statistically significant result of a t-test? [TY8.5]
- The probability that a difference at least as large as the observed difference could be produced by a particular random process will be less than the alpha level.
- The obtained value of t will exceed the alpha level.
- The rejection regions must be significantly different from each other.
- Both (a) and (c).
- Alpha must be set at .05.
Answer: A
6. Researchers conduct a t-test and obtain a p-value of .0012. Which of the following is an appropriate conclusion on the basis of the information provided? [TY8.6]
- The result is significant.
- The effect size will be large.
- Both (a) and (b).
- A 99% confidence interval for the differences between the means will include the observed difference.
- A 95% confidence interval for the differences between the means will not include the observed difference.
Answer: E
7. Researchers conduct a t-test to compare two groups and find that one of the groups has a much larger standard deviation than the other. Which of the following statements is true? [TY8.7]
- The variances are robust.
- The assumption of equal variance may have been violated.
- The researchers should make sure that their distributions are free of parameters.
- The standard deviations are not normal.
- Both (b) and (d).
Answer: B
8. If an experimenter were to conduct an experiment in which participants were randomly assigned to either a control condition or an experimental condition, which of the following statements would be true? [TY8.8]
- It will be appropriate to analyse results using a between-subjects t-test.
- Any statistical analysis will be based on pairs of responses.
- If a t-test is performed to analyse the results, it will have n − 1 degrees of freedom.
- The experiment involves two related samples.
- Both (a) and (c).
Answer: A
9. John, a second-year psychology student, is using the hypothesis-testing approach and an alpha level of .05 to examine a difference between two means. He discovers that this difference is associated with a t-value of 3.46. If the critical t-value with α = .05 is 2.056 what should he conclude? [TY8.9]
- That the difference between the means is statistically significant.
- That the alpha level is too high.
- That the alpha level is not high enough.
- That the experiment did not contain enough participants to draw a strong conclusion.
- That no conclusion can be made about the nature of the underlying populations.
Answer: A
10. Which of the following suggests that the assumptions underlying a between-subjects t-test have been violated? [TY8.10]
- Evidence that the dependent variable is normally distributed.
- Evidence that the samples being compared have unequal variances.
- Evidence that the manipulation of the independent variable had no effect.
- Evidence that sampling was random, and that scores were independent.
- None of the above.
Answer: B
11. Which of the following increases the likelihood of a Type II error when conducting a t-test? [TY8.11]
- A high alpha level.
- A large sample size.
- High power.
- Low random error.
- A small difference between means.
Answer: E
12. An experimenter conducts an experiment using a control group containing 8 subjects and an experimental group containing 8 subjects. How many degrees of freedom are there in this experimental design?
- 7
- 8
- 14
- 15
- 16
Answer: C
13. The graph below was generated by SPSS and plots participants’ scoreson the variable “Survey_Point” which can vary between 0 and 30. Looking at this graph, what might make these data inappropriate to analyse using a t-test?
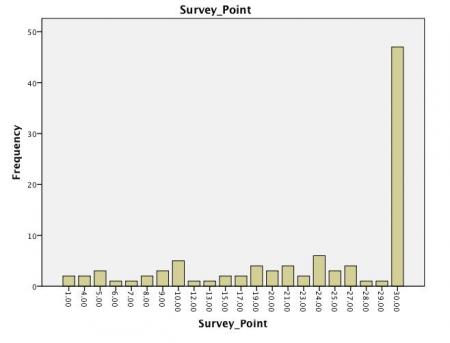
- The assumption of independence is violated.
- The assumption of normality is violated.
- The assumption of equal variance is violated.
- Both (a) and (b).
- Both (b) and (c).
Answer: B
14. “The probability, as revealed by a statistical test, that a random process (involving taking random samples of a particular size from a particular population) could produce some outcome.” What is this a glossary definition of?
- Random error
- Sampling error
- The random value
- The p-value
- The q-value
Answer: D
15. “An outcome where the probability that an effect at least as large as that observed could be produced by a random process is less than a predetermined alpha level. This means that it is implausible that a random process could have produced the effect.” Which construct is this a glossary definition of?
- Statistical significance.
- Power.
- Type I error.
- Type II error .
- Random error.
Answer: A
16. “The mistaken idea that random events are not independent. A gambler may believe that a long run of good or bad luck has to change. The gambler’s fallacy arises from a misunderstanding of the law of large numbers. The idea that a random process will behave in a predictable way on average over a long run of observations can be misunderstood to imply that there is ‘a law of averages’ that serves to change the probability of random events based on past events. However, coins, dice and other things that generate random outcomes do not have memories.” What type of fallacy is this a glossary definition of?
- The significance fallacy.
- The gambler’s fallacy.
- The causal fallacy.
- The operational fallacy.
- The psychological fallacy.
Answer: B