Activities
Activity 1: Design a piece of research
Imagine you are designing a piece of research to examine children’s appreciation of a museum or art gallery, which has opened a new interactive space aimed at younger visitors. The museum/gallery is especially keen to reach children with disabilities as well as families from the local, ethnically and linguistically diverse community.
Your aim is to elicit the perspectives of children aged three–five years of this new environment, which they will have an opportunity to visit on a few occasions. The children attend a local nursery/school. Half of the children come from multilingual homes and there are two children with a sensory impairment amongst this group (one has a sight impairment and the other, a hearing impairment). The nursery/school has a long history of involving parents/carers directly in its work. Imagine too that you are a researcher who does not work in this nursery/school.
Note down some different ways in which you could elicit the perspectives of children of this age range, drawing on what you have learnt from Chapter 17 of the book (looking at ‘creative’ methods) and any other relevant reading you have undertaken. As you do this, think about how all children can participate in this research project and try to justify the method in relation to this proposed research project, as well as thinking through its possible limitations. You may find the table below useful.
A study exploring young children’s appreciation of a museum/gallery
|
Proposed method |
How will this method support the aims of the study? |
What might you need to know further, e.g. about the children, the nursery/school or the museum/gallery space, in order to assess the suitability of the method in this research project? |
Possible limitations of the method |
|
|
|
|
|
|
|
|
|
|
|
|
|
|
|
|
|
|
|
|
Research may employ a range of different methods in a project, but it is unlikely that you would use all the methods you have thought of. Researchers also need to think about how methods fit together in terms of a cohesive research design and so might employ different methods at different stages of the research. In stating that you should imagine yourself to be a researcher new to the nursery/school, you would also need to think about your relationship with the children and the possible impact of this on the kinds of methods you might employ. Also, given that this piece of research centres on a nursery/school (in terms of the child participants) and a museum/gallery, there are adults who might be supportive of this project. Make a list of who they might be, based on information given. How might they be able to help you in eliciting the perspectives of the children?
Activity 2: Explore the work of Kate Pahl
Kate Pahl’s work (in England) explores the relationship between narratives and objects within the home/community. She uses a range of visual, participative strategies in her work. One such project explored home narratives and objects with a group of families of Pakistani heritage in Rotherham in Northern England, called ‘Ferham Families’. The resource ‘Every Objects Tells a Story’ can be viewed at: http://www.everyobjecttellsastory.org.uk/
Kate Pahl has also worked on a project entitled: ‘My Family, My Story’, which involved a group of families in North Yorkshire, England, constructing digital stories about their favourite objects and stories. More can be learnt about this project by visiting: http://www.mylearning.org/my-family-my-story/p-2761/
Families were asked to create their own ‘all about you story’ box of objects that held particular meaning for them – in effect, creating their own mini museum. In so doing, they were also thinking about the link between objects in the home and objects in museums.
You will see from the title of a chapter co-authored by Kate Pahl below that Pahl works in a way that draws on the New Literacy Studies and multimodality to think about communicative practices in the home and in communities:
Pahl, K. and Rowsell, J. (2013) ‘Artifactual literacies’, in J. Larson and J. Marsh (eds), The SAGE Handbook of Early Childhood Literacy, 2nd edn. London: SAGE, pp. 263–78.
In exploring the websites and this chapter, you can see that Pahl, like some other researchers, is keen to disseminate her work in ways that reach different audiences. Thus, the websites you have looked at are accessible to a wide audience of families and professionals, whereas her journal articles and books are written for a more academic audience. Most of all, we regard her work as a fascinating example of using participatory methods with children and families.
Activity 3: Consider the following scenario
This scenario is based on something that actually occurred in a London day nursery nearly 20 years ago.
Staff at an early years day care setting noticed that it was predominantly the boys who used the wheeled outside play equipment (tricycles, push-and-pull toys, sit-on trucks, etc.). They began to wonder if the girls thought that these toys were just for the boys. They decided to undertake some action research to try and increase the number of girls using such equipment. The first stage was to gather data to see if their impressions were correct. They decided that a structured time sample would be useful, where the number of boys and girls using the wheeled play equipment was counted every 30 minutes over a period of a day. Their observation sheets looked like this:
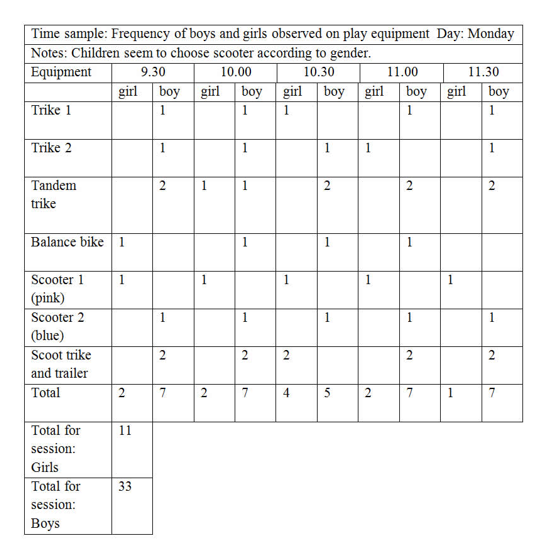
Before the observation started, the trikes were labelled with different-coloured ribbon so that they were easy to distinguish.
With a small data set such as this, it is easy to spot trends without doing much ‘analysis’. For example, it seems that the girls think the pink scooter is theirs and the blue bike is for boys. There was a different pattern of use seen in the afternoon when it was noted that more boys than usual played inside because of an activity that caught their imagination.
There is a piece of information missing from these charts – that is the number of boys and the number of girls in the nursery at the time of the observation. If, for instance, there are twice as many boys as girls, then the true picture may emerge if the boys’ total is divided by two.
The observations were continued for a week. The frequencies for each session were:
- Monday: a.m. girls 11, boys 33; p.m. girls 21, boys 24.
- Tuesday: a.m. girls 15, boys 30; p.m. girls 8, boys 30.
- Wednesday: a.m. girls 15, boys 25; p.m. girls 16, boys 28.
- Thursday: a.m. girls 21, boys 23; p.m. girls 19, boys 24.
- Friday: a.m. girls 24, boys 17; p.m. girls 12, boys 31.
Using these figures
- Find the average frequency for morning and afternoon sessions for the week.
- Put these figures into a table, making sure that you have included appropriate labels/headings.
- Put these figures into a bar chart, making sure that you have labelled the axes correctly and included all the information needed for a reader to be able to make sense of the information. Chapter 18 will help you in this.
- Assuming that there are approximately even numbers of boys and girls, write a paragraph about what the figures tell us.
The staff in the nursery, on which this scenario is based, initiated an intervention that was designed to make sure that both boys and girls had equal access to the equipment. They identified some equipment as being for boys and some for girls, originally by distinguishing them with different-coloured ribbon. The initiative was very successful. Eventually, the ribbons fell off but the children still kept to the equipment for ‘their’ gender, even without the staff reinforcing the initiative. Years later, a new member of staff joined and asked children how they knew a trike was for girls or boys. The children indicated that they could tell by the pattern of scratches and different wear and tear of the paintwork which was which. This shows how information is passed on from child to child as the original children were now teenagers. It also shows the wisdom of buying expensive equipment because the toys were still in excellent working order!
Activity 4
1. Calculate the mean, median and mode of the following set of numbers: 10, 15, 16, 12, 23, 10, 13, 14, 8, 9, 10, 18, 8, 10, 21, 10, 5, 8, 12, 8
2. Mary wanted to find out the percentage of mothers who rationed the amount of time their three-year-old children used any equipment with screens (tablets, phones, computers, TVs, etc.) She questioned 15 mothers and found that eight restricted screen time and seven didn’t. What is the percentage of parents who restricted screen time? With such a small sample of parents do you think that finding out the percentage helps us understand the data more clearly?