Chapter 12: Assumptions

Quizzes are available to test your understanding of the key concepts covered in each chapter. Click on the quiz below to get started.

1. 15,467 people rated how much they liked my textbook on a scale of 1 (it is rubbish) to 10 (I love it). The distribution of scores had a skew of 1.23 (SE = 0.65). Which of the following would be the best way to decide whether the skew is problematic? (Hint: Think about what you know about the central limit theorem.)

  1. See if the z-score is bigger than 1.96 or smaller than –1.96
  2. See if the skew is significant at p < 0.05.
  3. Use the Kolmogorov–Smirnov test.
  4. None of the options, because of the large sample size.

The correct answer is D. None of the options, because of the large sample size.

2. The Kolmogorov–Smirnov test can be used to test:

  1. Whether scores are measured at the interval level.
  2. Whether scores are normally distributed.
  3. Whether group variances are equal.
  4. Whether group means differ.

The correct answer is B. Whether scores are normally distributed. This is because the Kolmogorov–Smirnov test compares the scores in the sample to a normally distributed set of scores with the same mean and standard deviation.

3. Which of these variables would be considered not to have met the assumptions of parametric tests based on the normal distribution? (Hint: Many statistical tests rely on having data measured at the interval level.)

  1. Reaction time
  2. Temperature
  3. Gender
  4. Heart rate

The correct answer is C. Gender. This is because this variable is not measured at the interval level and would not be normally distributed.

4. What is the Shapiro–Wilk test primarily used for? (Hint: You can also use the Kolmogorov–Smirnov test to look at the same thing.)

  1. To test whether the distribution of scores deviates from a comparable normal distribution.
  2. To test for heterogeneity of variance
  3. To test for homogeneity of variance
  4. It is used to test for problematic outliers that could bias the results.

The correct answer is A. To test whether the distribution of scores deviates from a comparable normal distribution.

5. What does the graph below indicate about the normality of our data?

1

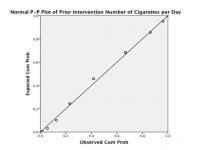
  1. The P-P plot reveals that the data deviate substantially from normal.
  2. We cannot infer anything about the normality of our data from this type of graph.
  3. The P-P plot reveals that the data deviate mildly from normal.
  4. The P-P plot reveals that the data are normal.

The correct answer is D. The P-P plot reveals that the data are normal. This is because the data points all fall very close to the ‘ideal’ diagonal line.