Chapter 13: Relationships
Quizzes are available to test your understanding of the key concepts covered in each chapter. Click on the quiz below to get started.
1. When interpreting a correlation coefficient, it is important to look at:
- The ± sign of the correlation coefficient.
- The magnitude of the correlation coefficient.
- The significance of the correlation coefficient.
- All of these.
2. Which of the following is not a condition of the chi-square test?
- The variables must have discrete categories
- There is a limit on how many cells can have a low expected value
- At least a count of 5 in each cell
- A null hypothesis of independence between the variables
The correct answer is C. Tables larger than 2 ´ 2 can have expected counts lower than 5, but a maximum of 20% of the cells could have an expected count less than 5.
3. The correlation between two variables A and B is 0.12 with a significance of p < 0.01. What can we conclude?
- That there is a substantial relationship between A and B.
- That variable A causes variable B.
- That there is a small relationship between A and B.
- That there is no relationship between A and B.
The correct answer is C. That there is a small relationship between A and B. This is because values of ±0.1 represent a small effect, ±0.3 is a medium effect and ±0.5 is a large effect (although these canned effect sizes are no substitute for interpreting the effect size within the context of the research literature).
4. The relationship between two variables partially out the effect that a third variable has on one of those variables can be expressed using a:
- Partial correlation
- Semi-partial correlation
- Bivariate correlation
- Point-biserial correlation
The correct answer is B. This is because in a semi-partial correlation we partial out the effect that the third variable has on only one of the variables in the correlation.
5. Which is the best description of what the following table of countries shows?
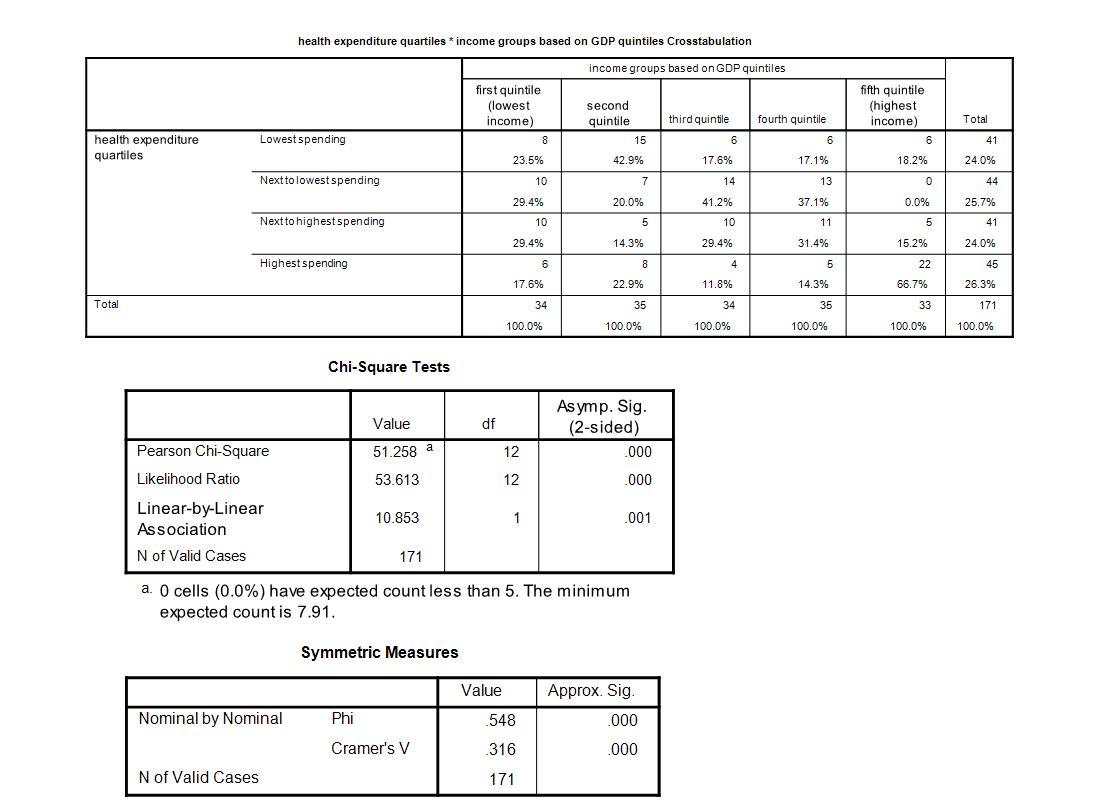
- There is a clear gradient from the lowest income countries spending the least on health care to the highest income countries spending the most on health care
- While there is a gradient that reflects the positive relationship between income and health expenditure, it is not a perfect relationship
- There is no meaningful relationship at all between income and health expenditure
- There is a gradient that reflects the positive relationship between income and health expenditure, but it is too weak to make any firm conclusions
The correct answer is B. Although the chi-square shows a there is a statistically significant relationship, a careful look at the distribution of the column percentages per each band of health expenditure, we realise that rich countries in the third or fourth quartile do not spend more than the poorest countries.