An Adventure in Statistics: The Reality Enigma
Chapter 14: The general linear model
Quizzes are available to test your understanding of the key concepts covered in each chapter. Click on the quiz below to get started.
1. A psychologist was interested in whether the number of news people watch (minutes per day) predicts how depressed they are (from 0 = not depressed to 7 = very depressed). What does the standardized beta tell us in the output?
(Hint: The standardized beta values are measured in standard deviation units.)
- As news exposure decreases by 0.224 standard deviations, depression increases by 1 standard deviation.
- As news exposure increases by 1 minute, depression decreases by 0.224 units.
- As news exposure decreases by 0.224 minutes, depression increases by 1 unit.
- As news exposure increases by 1 standard deviation, depression decreases by 0.224 of a standard deviation.
2. A psychologist was interested in whether the amount of news people watch predicts how depressed they are. Based on the output, is news exposure a significant predictor of depression?
- No, because the bootstrap significance value of news exposure is greater than 0.05.
- Yes, because the p-value for news exposure is 0.039, which is less than 0.05.
- Yes, because the bootstrapped confidence interval for news exposure contains zero.
- No, because the confidence interval for news exposure does not contain zero.
3. A consumer researcher was interested in what factors influence people’s fear responses to horror films. She measured gender (0 = female, 1 = male) and how much a person is prone to believe in things that are not real (fantasy proneness) on a scale from 0 to 4 (0 = not at all fantasy-prone, 4 = very fantasy-prone). Fear responses were measured on a scale from 0 (not at all scared) to 15 (the most scared I have ever felt). What is the likely population value of the parameter describing the relationship between gender and fear?
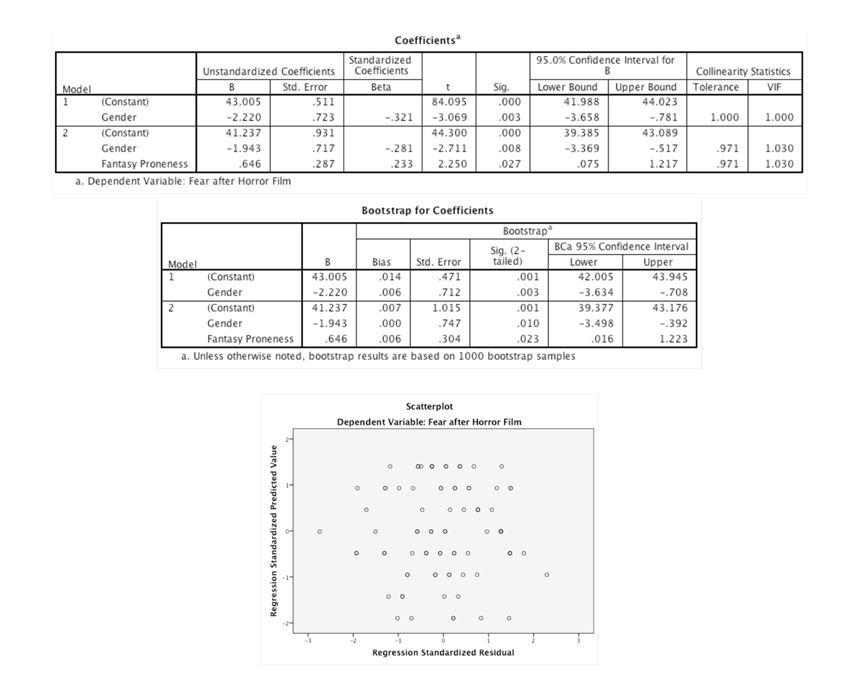
- -1.943
- Somewhere between -3.498 and -0.392
- Somewhere between -3.369 and -0.517
- 0.008
4. A psychologist was interested in whether the amount of news people watch predicts how depressed they are. Based on the output below, is there evidence that a meaningful relationship exists in the population?
- Yes, because the p-value for news exposure is 0.039, which is less than 0.05.
- No, because the bootstrap confidence interval for news exposure contains zero.
- Yes, because the confidence interval for news exposure does not contain zero.
- No, because the b-value for news exposure is close to zero.
5. A consumer researcher was interested in what factors influence people’s fear responses to horror films. She measured gender (0 = female, 1 = male) and how much a person is prone to believe in things that are not real (fantasy proneness) on a scale from 0 to 4 (0 = not at all fantasy-prone, 4 = very fantasy-prone). Fear responses were measured on a scale from 0 (not at all scared) to 15 (the most scared I have ever felt). How much variance (as a percentage) in fear is shared by gender and fantasy proneness in the population?
- 13.5%
- 15.6%
- 39.5%
- 7.4%