Chapter 5: Presenting data
Quizzes are available to test your understanding of the key concepts covered in each chapter. Click on the quiz below to get started.
1. What is this graph known as?
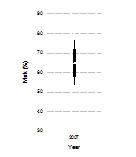
- A scatterplot
- A box–whisker diagram
- A histogram
- An error bar chart
The correct answer is B. A box-whisker diagram.
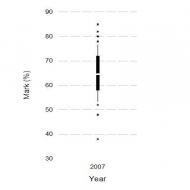
2. Based on the chart, what was the median mark (approximately)?
- 72%
- 58%
- 77%
- 65%
The correct answer is D. 65%. This is because the centre of the boxplot (the white space between the two black boxes) falls at about 65% on the y-axis.
3. Based on the chart, what was the interquartile range of marks (approximately).
- 14%
- 7%
- 22%
- 47%
The correct answer is A) 14%. This is because 72% – 58% = 14%.
4. What does a histogram show? (Hint: Histograms are also known as frequency distributions.)
- A histogram is a graph in which values of observations are plotted on the horizontal axis, and their density is plotted on the vertical axis.
- A histogram is a graph in which levels of the independent variable are plotted on the horizontal axis, and the mean of observations is plotted on the vertical axis.
- A histogram is a graph in which values of observations are plotted on the horizontal axis, and the frequency with which each value occurs in the data set is plotted on the vertical axis.
- A histogram is a graph in which values of one variable are plotted against values of a different variable.
The correct answer is C. A histogram is a graph in which values of observations are plotted on the horizontal axis, and the frequency with which each value occurs in the data set is plotted on the vertical axis.
5. Imagine we took a group of smokers, recorded the number of cigarettes they smoked each day, whether they wanted to quit smoking or not, and then split them randomly into one of two 6-week interventions; ‘hypnosis’ or ‘nicotine patch’. After the 6 weeks, we again recorded how many cigarettes they smoked each day and subtracted this number from the number of cigarettes they each smoked pre-intervention, to produce an intervention success score for each participant. Out of the following options, which would be the best method of looking at which intervention was the most successful, taking into account whether the participant wanted to quit or not?
- Clustered boxplot
- Frequency polygon
- Simple histogram
- Population pyramid
The correct answer is A. Clustered boxplot. This is because with this option we could produce boxplots not just for the nicotine and hypnosis groups, but within these groups we could have different-coloured boxplots for those who want to quit and those who do not.