A Step-by-Step Introduction to Statistics for Business
Chapter 10: Analysis of Variance (ANOVA)
Answers for Data Skill Challenges for every chapter in the book can be found to check your performance and widen your understanding.
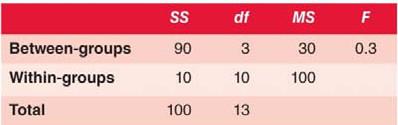
1) Fcrit(3, 10) = +3.71
F(3, 10) = 0.3, p >.05
Figure 10.1
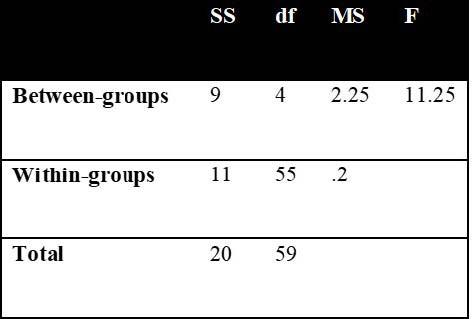
2) Fcrit(4, 55) = +2.56
F(4, 55) = 11.25, p < .05
Figure 10.2
3) Figure 10.3
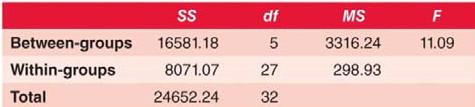
RQ: Do any of the website designs produce different viewing times from the other website designs?
H0: μ1 = μ2 = μ3 = μ4 = μ5 = μ6
H1: At least two means differ
α = .05
Fcrit(5, 27) = +2.57 (Excel) or Fcrit(5, 27) = +2.76 (by hand)
F(5, 27) = 11.09, p <.05
η2 = 0.67
Conclusion: Reject the null and accept the alternative. The ratio is statistically significant. At least two website designs have different means. Website design accounts for 67% of the total variance in viewing times. In post-hoc analyses, three homogeneous subgroups were identified. The first subgroup, containing Designs B, E and H, resulted in longer viewing times than the second subgroup, containing Designs B, C, E and F, which resulted in longer viewing times than the third subgroup, containing Designs C, F and G.
4) Figure 10.4
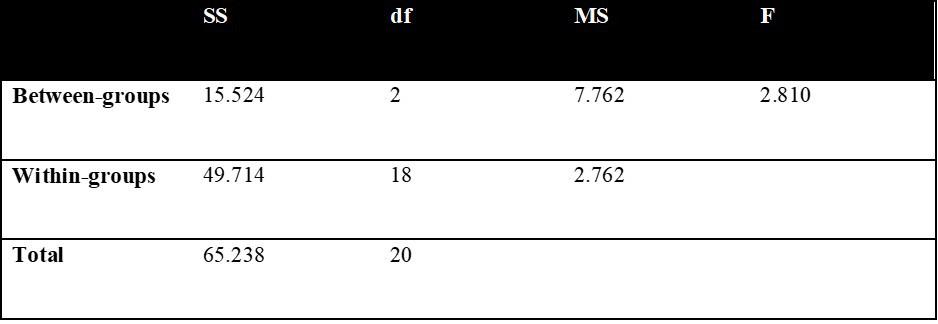
RQ: Do customers tip differently depending on the time of day?
H0: μ1 = μ2 = μ3
H1: At least two means differ
α = .05
Fcrit(2, 18) = +3.55
F(2, 18) = 2.81, p > .05
Conclusion: Retain the null. The ratio is not statistically significant. There is not sufficient evidence to conclude that customers tip differently based on time of day.