Windows

On this part of the website, you have free access to up to date click-by-click instructions for NVivo on Windows. Simply click on the headings below to reveal the instructions.

Use the index of click-by-click instructions as a companion guide to help you find the instructions you need, or browse through the instructions below that accompany this chapter.

6.a. Importing a survey prepared in Excel, Importing survey data from SurveyMonkey or Qualtrics and viewing and (interactively) coding survey data in NVivo

Importing a survey prepared in Excel

  • Ribbon: Import > Excel.
  • Browse to locate the Excel file > Open > Next. The Survey Import Wizard (Figure 6.3) will open. Step 1 of the wizard provides information only > Next.

figure_6.3.png

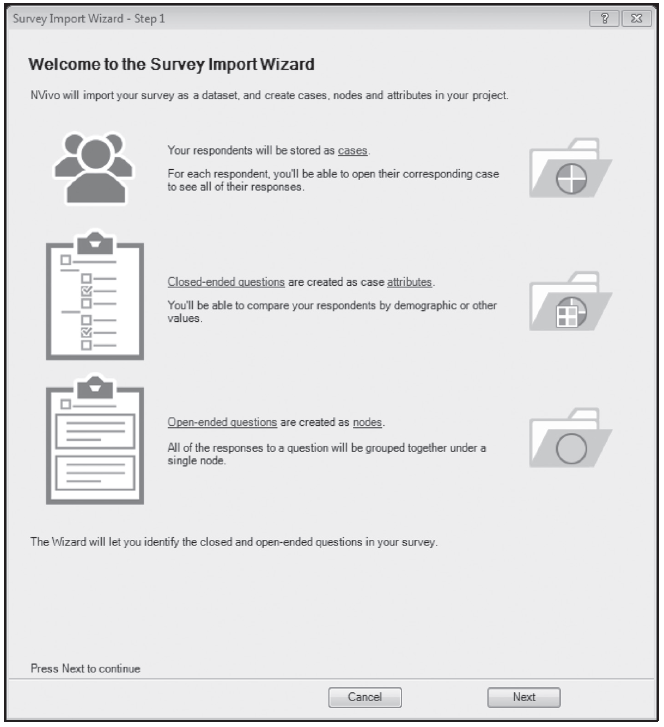
Figure 6.3 The Survey Import Wizard

  • Survey Import Wizard: Step 2: > Check data format.
  • Check the number of rows used for question headers (e.g., SurveyMonkey typically uses two; in Excel, you would normally have just one).
  • Check the format of your dates and times, if you have them (hover for additional information) > Next.
  • Survey Import Wizard: Step 3: > Manage your survey respondents. This step creates Cases for your respondents.
    • Choose where you want to store your Cases. Cases can be already existing, or new, but all will need to be in the same location (in a Folder, or under a parent Case).
    • Indicate which column in your survey data identifies the Cases.
    • Indicate the Case Type of the Cases (as explained in Chapter 5): are you creating a new Classification for them or using an existing one? > Next.
  • Survey Import Wizard: Step 4: Check that NVivo has correctly identified which questions in your survey are open-ended (qualitative) and closed-ended (quantitative), as shown in Figure 6.4. NVivo allows you to scan the first 25 cases to check your choices.
    • Data from open-ended questions will be stored in a Folder (with the same name as your survey) under Nodes.
    • Data from closed-ended questions will become Attributes of Cases > Finish (if you are in NVivo Pro).

figure_6.4.png

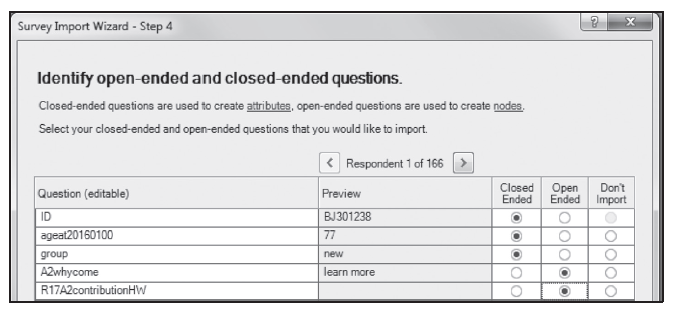
Figure 6.4 Choosing question type in Step 4 of the Survey Import Wizard

  • NVivo Plus users:
    •  Step 5: (NVivo Plus only) > Auto code Themes and Sentiment (Figure 6.5) > Finish. NVivo will then show you the progress of your import.

figure_6.5.png

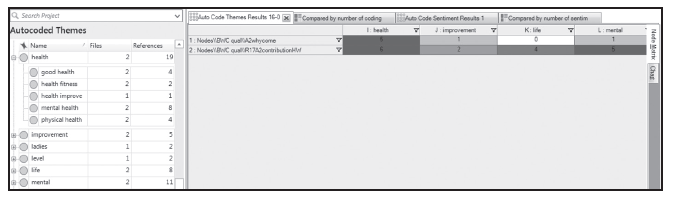
Figure 6.5 Nodes and Matrix display of results from auto coding themes related to wellbeing (Windows Plus)

Importing survey data from SurveyMonkey or Qualtrics

  • Ribbon: Import > Import Survey > From SurveyMonkey/Qualtrics.
  • You will then be asked to provide your login details to continue.

Once you have located your file, the Survey Import Wizard will open and you can continue to work through the wizard as for Excel (above).

Viewing and (interactively) coding survey data in NVivo

  • List View: Double-click [your survey file] to open it.
  • Detail View: Use the tabs on the right margin to display the information in Table or Form view.

6.b. Using Node retrievals in a complementary mixed methods analysis

Nodes are retrieved in the usual way, but Coding Stripes can be displayed to show additional complementary data.

Retrievals with complementary Case or Node data

  • Navigation View: Codes > Nodes.
  • List View: Double-click on a Node to open it in Detail View.
  • Ribbon: Node Tools. Use Coding Stripes > Nodes Most Coding to show intersecting Nodes and Cases as you work through the retrievals; or
  • Ribbon: Node Tools. Use Coding Stripes > Coding Density Only > hover over the grey bar in the Coding Stripes area to see the intersecting Nodes and Cases.

Retrievals with complementary Attribute data

  • Ribbon: Node Tools. Use Coding Stripes > Selected Items > Case Classifications > Select a Classification from the right side of the dialogue to limit which Attribute Values are shown > OK.

Record what you have learned

  • List View: Right-click on the Node > Memo Link > Link to New Memo > provide a Name > OK.
  • Record what you learn from reviewing that topic and its associated data. Use See Also Links (Chapter 1) to connect an insight with the quote or other item that prompted it.

6.c. Constructing a joint display using the Framework Matrix tool 

Create Cases for the Files

Create Cases for the Files you want to use in your joint display, if they don’t already exist; or to compare groups of Files of particular types (such as are stored in Folders):

  • List View: Right-click on the Folder or on selected Files > Create As Set > Name it > OK.
  • Navigation View: Search > Sets > [your new Set] > Right-click > Create as Code (save to a new Folder in the Cases area to keep these separate from your regular Cases).

Create the Framework Matrix

  • Ribbon: Create > Framework Matrices > Name your new Framework Matrix.
    • Rows tab > Select the Cases made from Files (or groups of Files).
    • Columns tab > Select the Nodes you want to compare across > OK.

Show the intersecting content

  • Detail View: Click in any cell to activate the Framework Matrix tab in the Ribbon.
  • To show the intersecting content in any cell:
    • Ribbon: Framework Matrix > Associated View > Cell Coding.
    • Click in any cell to see the intersecting content in the Associated Data panel on the right.

Fill cells with intersecting content

To fill the cells with content, you have two options:

  • Work through and type in your own summaries (Figure 6.7); or
  • Fill with all intersecting content. (Beware: this is likely to create a very large table.)
    • Ribbon: Framework Matrix > Auto Summarize > OK.

Export the table

  • Detail View: Right-click > Export Framework Matrix (to Excel).
  • In Excel, select the matrix > Copy > New Sheet > Right-click > Paste (Transpose) to obtain a classic Joint Display.

6.d. Transforming Codes using a Crosstab

Set up the data in a Crosstab

  • Ribbon: Query > Crosstab (Windows: Figure 6.9).
  • Detail View: Crosstab Criteria > Crosstab codes against > Cases.
  • Add Codes to the Crosstab (drag or click È).
  • Add Cases to the Crosstab (drag or click È).
  • Crosstab Criteria > Search in > Choose options for where to search.
  • Run Query.
  • Ribbon: Crosstab Tools > Select options for what is counted (Coding References or Coding Presence) and how these are shown (Counts).

figure_6.9.png

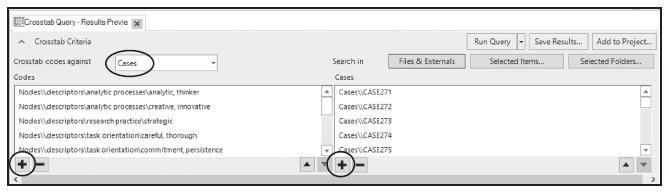
Figure 6.9 Crosstab specifications used for transformation of coding to variable data (Windows)

Export the data

  • Detail View: Right-click > Export Crosstab Results > Select your preferred File type (Excel or SPSS), and Save.

Coding Presence will be converted to 0/1 codes in an exported SPSS file.

6.e. Run a Matrix Coding Query

  • Ribbon: Explore > Matrix Coding. A set-up panel will open in Detail View (Figure 6.11).

Select Nodes for Rows in the Matrix

Select project items (e.g., Sets – or Nodes) for the Columns in the Matrix

  • Detail View: Matrix Criteria > Click the plus symbol at the bottom left of the Columns panel > Select Items.
    • In the Select Project Items dialogue > click Nodes or Sets (do not check the box!).
    • Check the boxes next to the specific Nodes or Sets you want in your Query > OK
  • If Sets are selected: Click on the first (Collections) icon at the bottom-right of the Columns panel to check the options for displaying Sets. The default is to show each Collection member (e.g., Set member) as a single item, using one column for each Set.
  • Use the minus symbol to remove any unwanted selections.
  • Detail View: Check options at the top right of the Matrix dialogue:
    • Matrix Criteria > Search in: Choose whether you want all Files and Externals, Selected Items (particular Files, Nodes, Cases, or Sets), or all items within Selected Folders to be included in the analysis.
    • Add to project allows you to store the specification for the Matrix Coding Query so that you can run it again at a later time, for example, if you add to or change your data in some way, or for a different Folder of Files or Selected Items.
  • Run Query.

View and refine Matrix Query results

  • Ribbon: Matrix Tools > Refine the display using options in the Cell Shading, Cell Content, and View groups (Figure 6.11).
  • Detail View: Double-click on any cell to see the associated text.
  • Save Results will store the results for future reference (located in Navigation View: Search > Query Results). Saved Results will not be updated if your data change.

6.f. Cluster Files or Nodes for a multidimensional display 

Cluster Files

  • Navigation View: Data > Files.
  • List View: Select Files for clustering (Files need to be in the same Folder).
  • Right-click > Visualize > Cluster Analysis of Selected Items.

Cluster Nodes

  • Navigation View: Codes > Nodes.
  • List View: Select Nodes for clustering (Nodes can be in different trees, but need to be at the same hierarchical level).
  • Right-click > Visualize > Cluster Analysis of Codes or Cases.

Modify the display (the display must be open in Detail View)

  • Ribbon: Cluster Analysis > Options > Clusters > Change the number of clusters shown to improve the readability of the display.
  • Ribbon: Cluster Analysis > Select Data to change the display to a clustering based on Coding similarity rather than Word similarity.
  • Ribbon: Cluster Analysis > Type. Change the display from a dendrogram to a 3D Cluster Map and experiment with rotating the MDS display using the mouse.
  • Detail View: Double-click on an item in any display, to open it.