Mac

On this part of the website, you have free access to up to date click-by-click instructions for NVivo on Mac. Simply click on the headings below to reveal the instructions.

Use the index of click-by-click instructions as a companion guide to help you find the instructions you need, or browse through the instructions below that accompany this chapter.

As there are some functions in NVivo that can only be carried out in Windows, there are deliberate gaps in the Mac instructions numbering system when a tool is not available. This is so that the numbering system matches the book and the index of instructions.

6.a. Importing a survey prepared in Excel and viewing and (interactively) coding survey data in NVivo

Importing a survey prepared in Excel

  • Ribbon: Data > Import Dataset > Select the file > Open.
  • Import Dataset Assistant: Step 2 of 5 (if you only have 1 sheet in your workbook, this step will be skipped and the remaining steps will be 2 of 4, 3 of 4, etc.).
    • Select the worksheet you want to import > Next.
  • Import Dataset Assistant: Step 3 of 5.
    • Check the format of your dates and times, if you have them.
    • Tick First row contains field names > Next.
  • Import Dataset Assistant: Step 4 of 5 (Figure 6.6).
    • Check that NVivo has correctly identified which questions in your survey are Classifying (quantitative) and which are Codable (qualitative). NVivo allows you to change the name of each field, skip fields and change the type of Classifying fields. Examine the first 25 cases, to check your choices > Next.
  • Import Dataset Assistant: Step 5 of 5.
    • Option to change the Name of the Dataset > Import.

figure_6.6.jpg

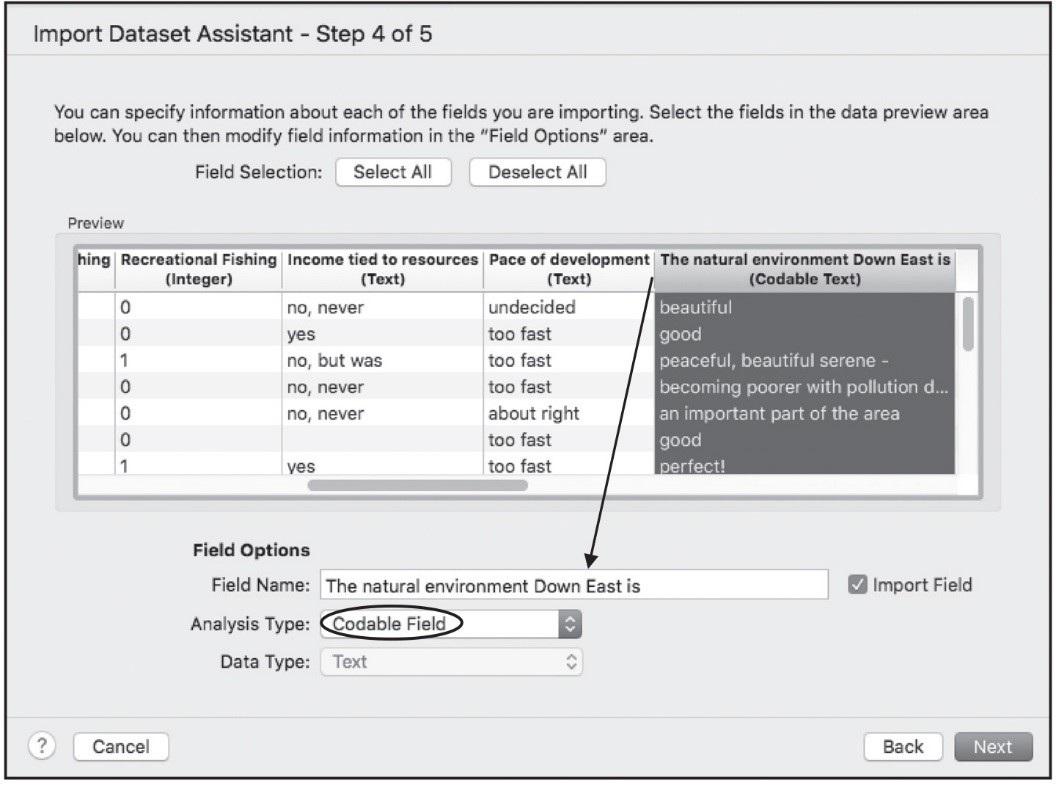
Figure 6.6 Choosing question type in Step 3 of the Import Dataset Assistant (Mac)

You might need to take additional steps to create a Node for each open-ended question and to create Cases and a Classification system. Search the online Mac Help for ‘Approaches to Analyzing Survey Results’.

Viewing and (interactively) coding survey data in NVivo

  • List View: Double-click [your survey file] to open it.

6.b. Using Node retrievals in a complementary mixed methods analysis

Nodes are retrieved in the usual way, but Coding Stripes can be displayed to show additional complementary data.

Retrievals with complementary Case or Node data

  • Navigation View: Codes > Nodes.
  • List View: Double-click on a Node to open it in Detail View.
  • Ribbon: View. Use Coding Stripes > Nodes Most Coding to show intersecting Nodes and Cases as you work through the retrievals; or

Record what you have learned

  • List View: Right-click on the Node > Memo Link > Link to New Memo > provide a Name > Done.
  • Record what you learn from reviewing that topic and its associated data.

6.d. Transforming Codes using a Crosstab

Set up the data in a Crosstab

  • Ribbon: Explore > Crosstab (Figure 6.10).
  • Options panel > Query > Show node against > Cases.
  • Add Codes to the Crosstab (drag or click +).
  • Add Cases to the Crosstab (drag or click+).
  • Crosstab Query > Search in > Choose options for where to search.
  • Run Query.
  • Options panel > Results > Select options for what is counted (Coding References or Coding Presence) and how these are shown (Counts).

figure_6.10.jpg

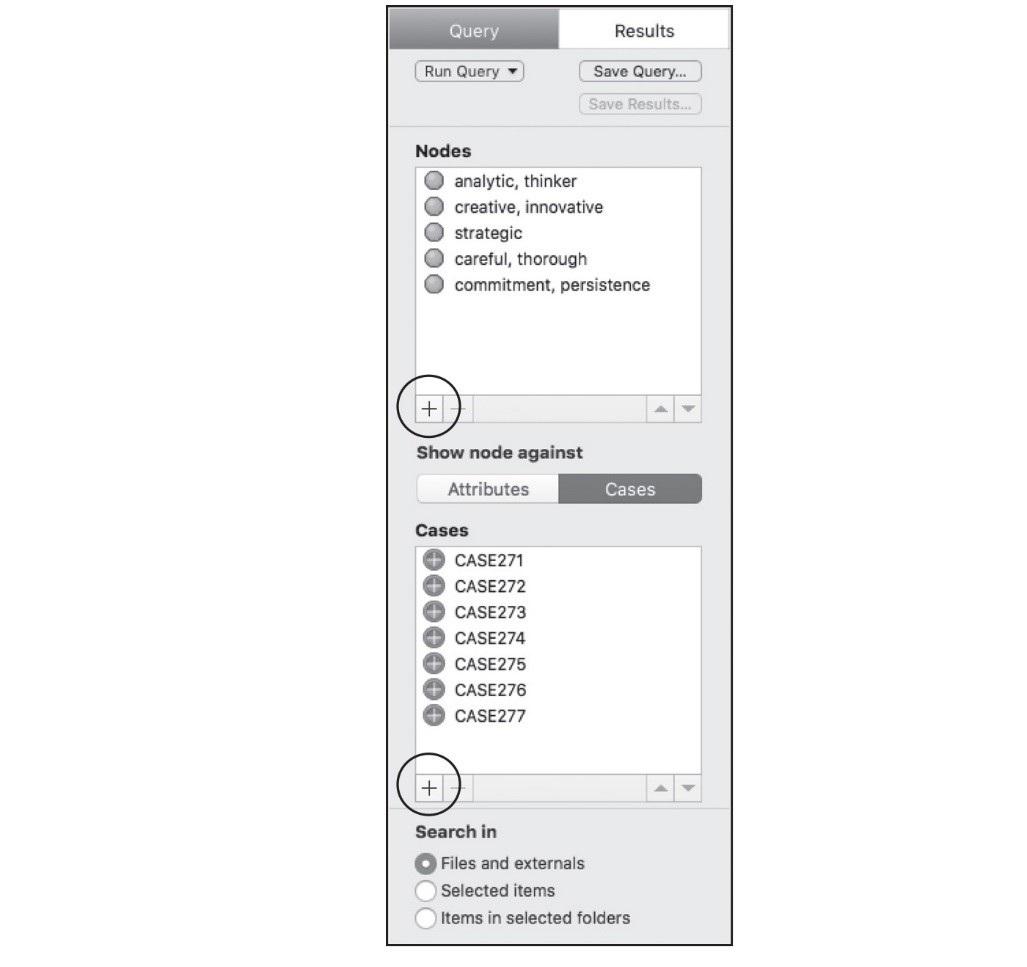
Figure 6.10 Crosstab specifications used for transformation of coding to variable data (Mac)

Export the data

  • Detail View Top: Share Button > Select your preferred File type (Spreadsheet or SPSS) > OK.

Coding Presence will be converted to 0/1 codes in an exported SPSS file.

6.e. Run a Matrix Coding Query

  • Ribbon: Query > Matrix Coding. A set-up panel will open in Detail View (Figure 6.11).

Select Nodes for Rows in the Matrix

  • Detail View: Matrix Coding Search Criteria > Click the plus symbol at the bottom-left of the Rows panel > Select Items.
    • In the Select Project Items dialogue, click on the word Nodes (do not check the box!).
    • Check the boxes next to the Nodes you want in your Matrix Coding Query > Select.
  • Use the minus symbol to remove any unwanted selections.

Select project items (e.g., Sets – or Nodes) for the Columns in the Matrix

  • Detail View: Matrix Coding Search Criteria > Click the plus symbol at the bottom left of the Columns panel > Select Items.
    • In the Select Project Items dialogue > click Nodes (do not check the box!).
    • Check the boxes next to the specific Nodes you want in your Query > Select.
  • Use the minus symbol to remove any unwanted selections.
  • Detail View: Check options at the top right of the Matrix dialogue:
    • Matrix Coding Search Criteria > Search in: Choose whether you want all Files & Externals, Selected Items (particular Files, Nodes, Cases, or Sets), or all items within Selected Folders to be included in the analysis.
    • Save Query allows you to store the specification for the Matrix Coding Query so that you can run it again at a later time, for example, if you add to or change your data in some way, or for a different Folder of Files or Selected Items.
  • Run Query.

View and refine Matrix Query results

  • Ribbon: View > Node Matrix > Refine the display using options in the Cell Shading, Cell Content, and groups (Figure 6.11).
  • Detail View: Double-click on any cell to see the associated text.
  • Save Results will store the results for future reference (located in Navigation View: Search > Query Results). Saved Results will not be updated if your data change.