Research Methods in Early Childhood: An Introductory Guide
Chapter 18: Analysing and presenting quantitative data
Activity 1: Consider the following scenario
This scenario is based on something that actually occurred in a London day nursery nearly 20 years ago.
Staff at an early years day care setting noticed that it was predominantly the boys who used the wheeled outside play equipment (tricycles, push-and-pull toys, sit-on trucks, etc.). They began to wonder if the girls thought that these toys were just for the boys. They decided to undertake some action research to try and increase the number of girls using such equipment. The first stage was to gather data to see if their impressions were correct. They decided that a structured time sample would be useful, where the number of boys and girls using the wheeled play equipment was counted every 30 minutes over a period of a day. Their observation sheets looked like this:
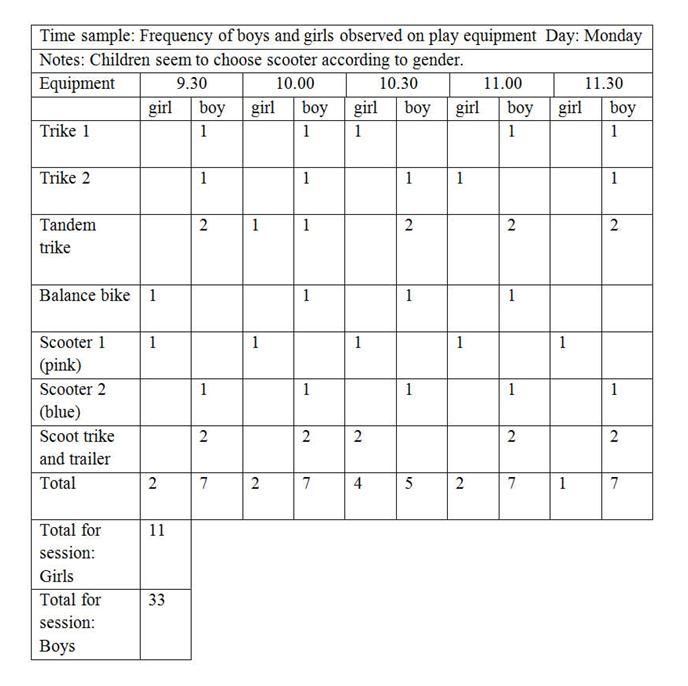
Before the observation started, the trikes were labelled with different-coloured ribbon so that they were easy to distinguish.
With a small data set such as this, it is easy to spot trends without doing much ‘analysis’. For example, it seems that the girls think the pink scooter is theirs and the blue bike is for boys. There was a different pattern of use seen in the afternoon when it was noted that more boys than usual played inside because of an activity that caught their imagination.
There is a piece of information missing from these charts – the number of boys and girls in the nursery at the time of the observation. If, for instance, there are twice as many boys as girls, then the true picture may emerge if the boys’ total is divided by 2.
The observations were continued for a week. The frequencies for each session were:
- Monday: a.m. girls 11, boys 33; p.m. girls 21, boys 24.
- Tuesday: a.m. girls 15, boys 30; p.m. girls 8, boys 30.
- Wednesday: a.m. girls 15, boys 25; p.m. girls 16, boys 28.
- Thursday: a.m. girls 21, boys 23; p.m. girls 19, boys 24.
- Friday: a.m. girls 24, boys 17; p.m. girls 12, boys 31.
Using these figures
- Find the average frequency for morning and afternoon sessions for the week.
- Put these figures into a table, making sure that you have included appropriate labels/headings.
- Put these figures into a bar chart, making sure that you have labelled the axes correctly and included all the information needed for a reader to be able to make sense of the information. Chapter 18 will help you in this.
- Assuming that there are approximately even numbers of boys and girls, write a paragraph about what the figures tell us.
The staff in the nursery, on which this scenario is based, initiated an intervention that was designed to make sure that both boys and girls had equal access to the equipment. They identified some equipment as being for boys and some for girls, originally by distinguishing them with different-coloured ribbon. The initiative was very successful. Eventually, the ribbons fell off but the children still kept to the equipment for ‘their’ gender, even without the staff reinforcing the initiative. Years later, a new member of staff joined and asked children how they knew a trike was for girls or boys. The children indicated that they could tell by the pattern of scratches and different wear and tear of the paintwork which was which. This shows how information is passed on from child to child as the original children were now teenagers. It also shows the wisdom of buying expensive equipment because the toys were still in excellent working order!