Analyzing Social Networks
Chapter 10: Centrality
10.8 Problems and Exercises
› Click here to download corresponding data
1. For each of the following centrality measures discuss the appropriateness of each for analyzing both directed and undirected binary networks.
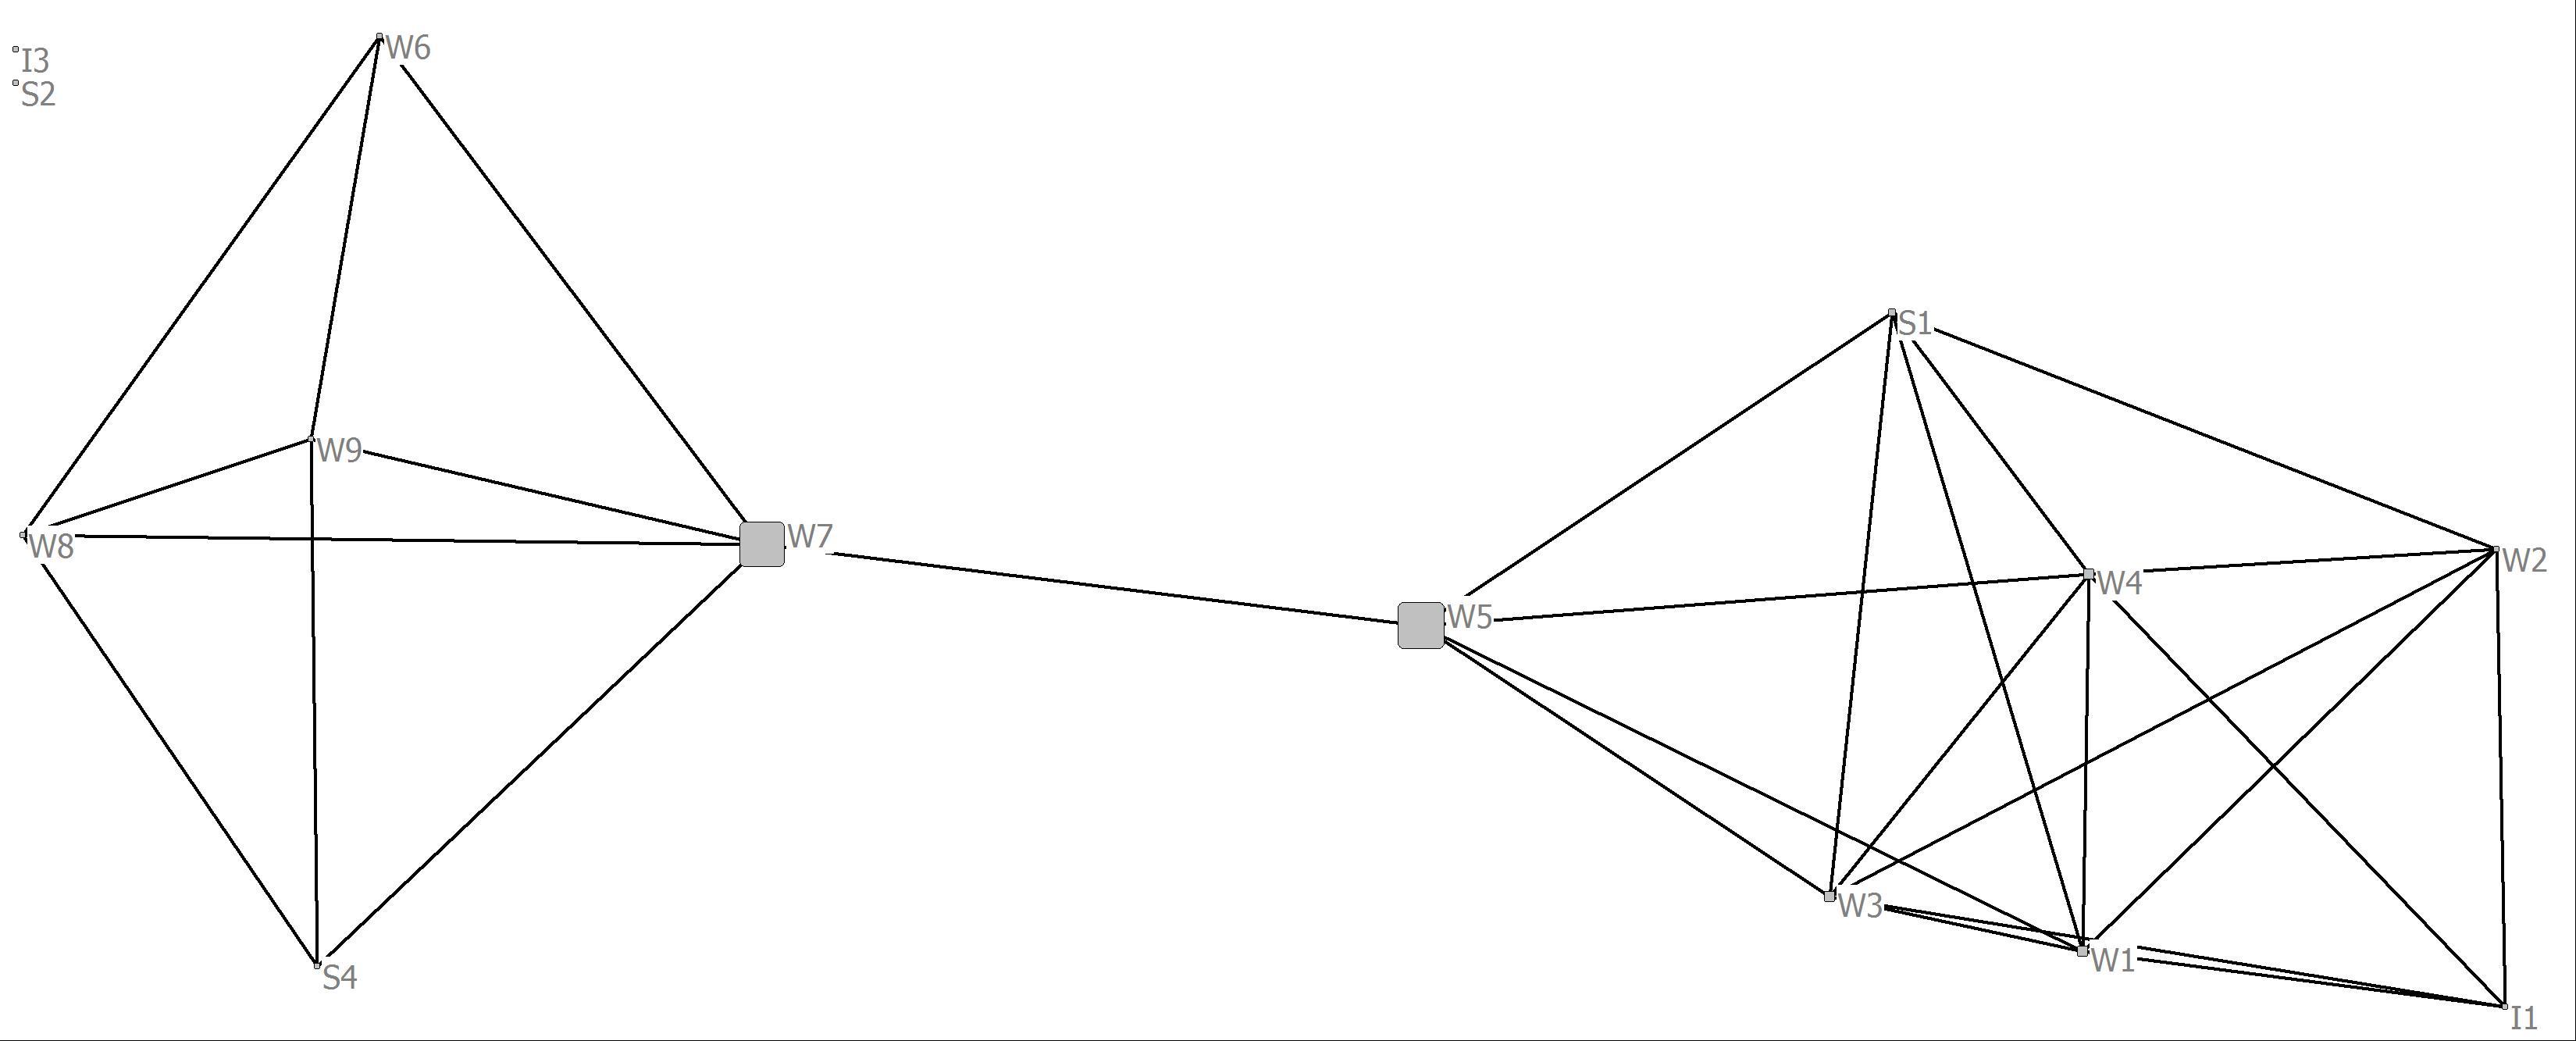
2. In the problems that follow we will primarily be using the bank wiring game network (wiringRDGAM.##h) for analyzing a select set of centrality measures. The social network is an undirected graph of who plays games with whom in the bank wiring room. For each of the following centrality measures conduct an analysis one measure at a time and save the results as an attribute file. Be sure to note the name of the output files since you will be using them later.
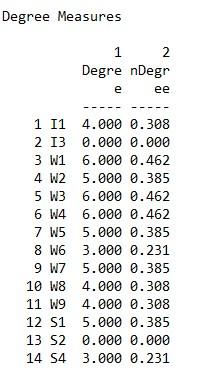
Degree output
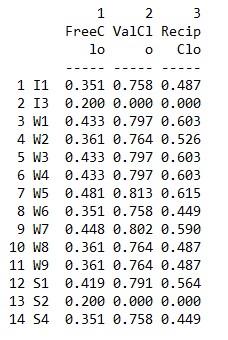
Closeness output
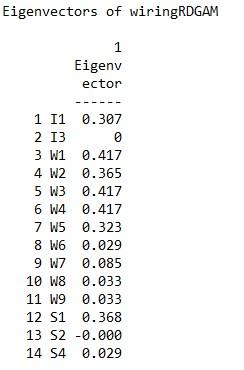
Eigenvector output
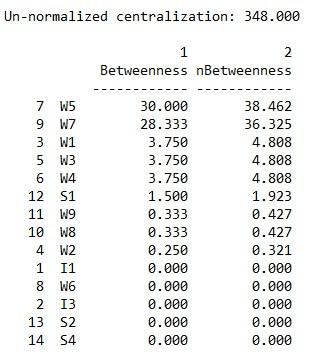
Betweenness centrality output
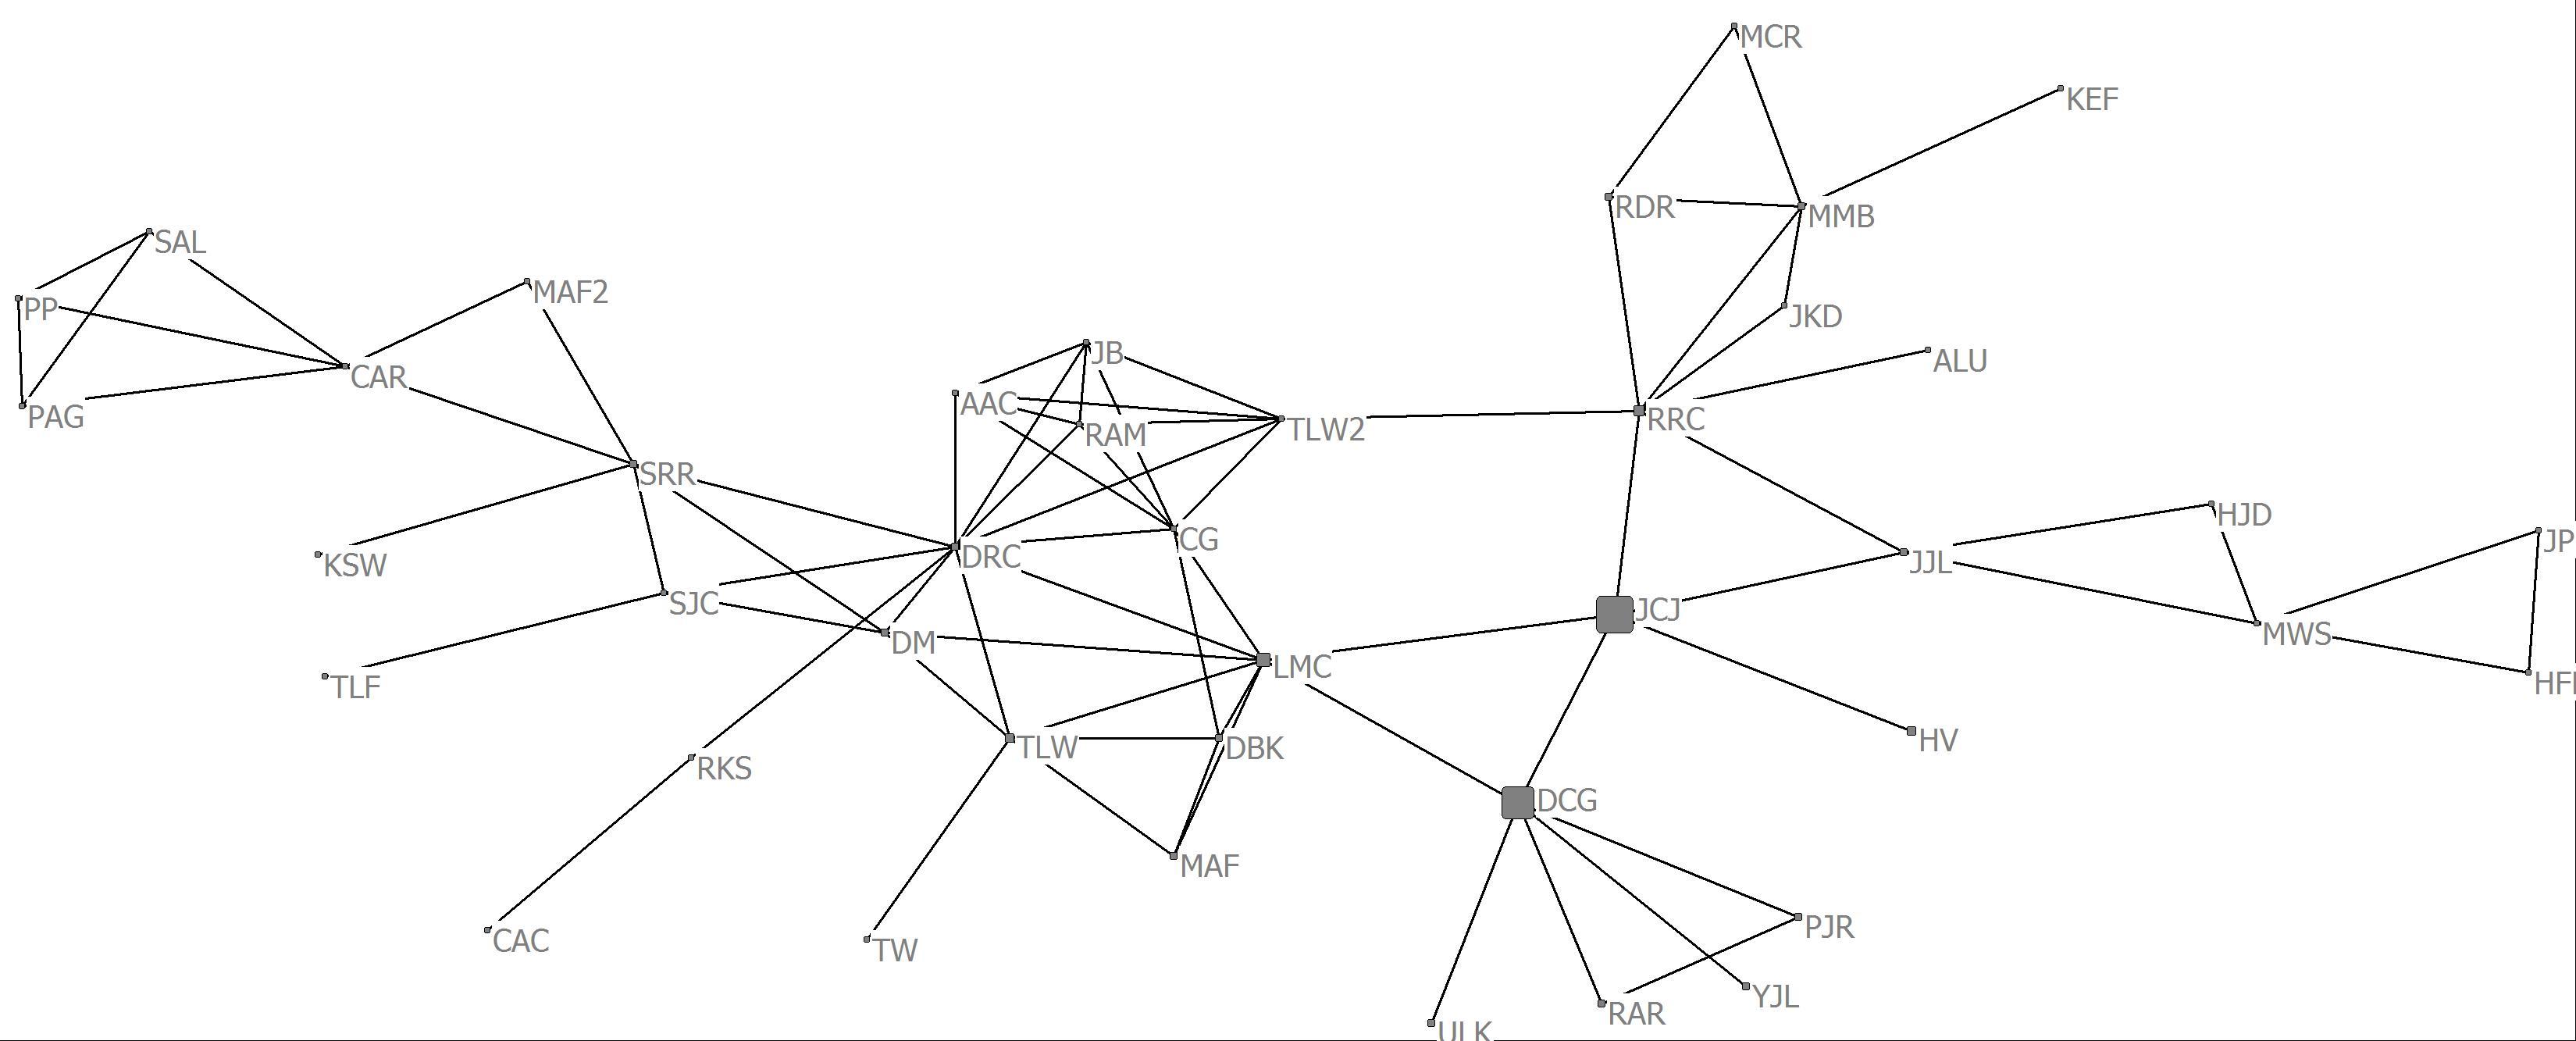
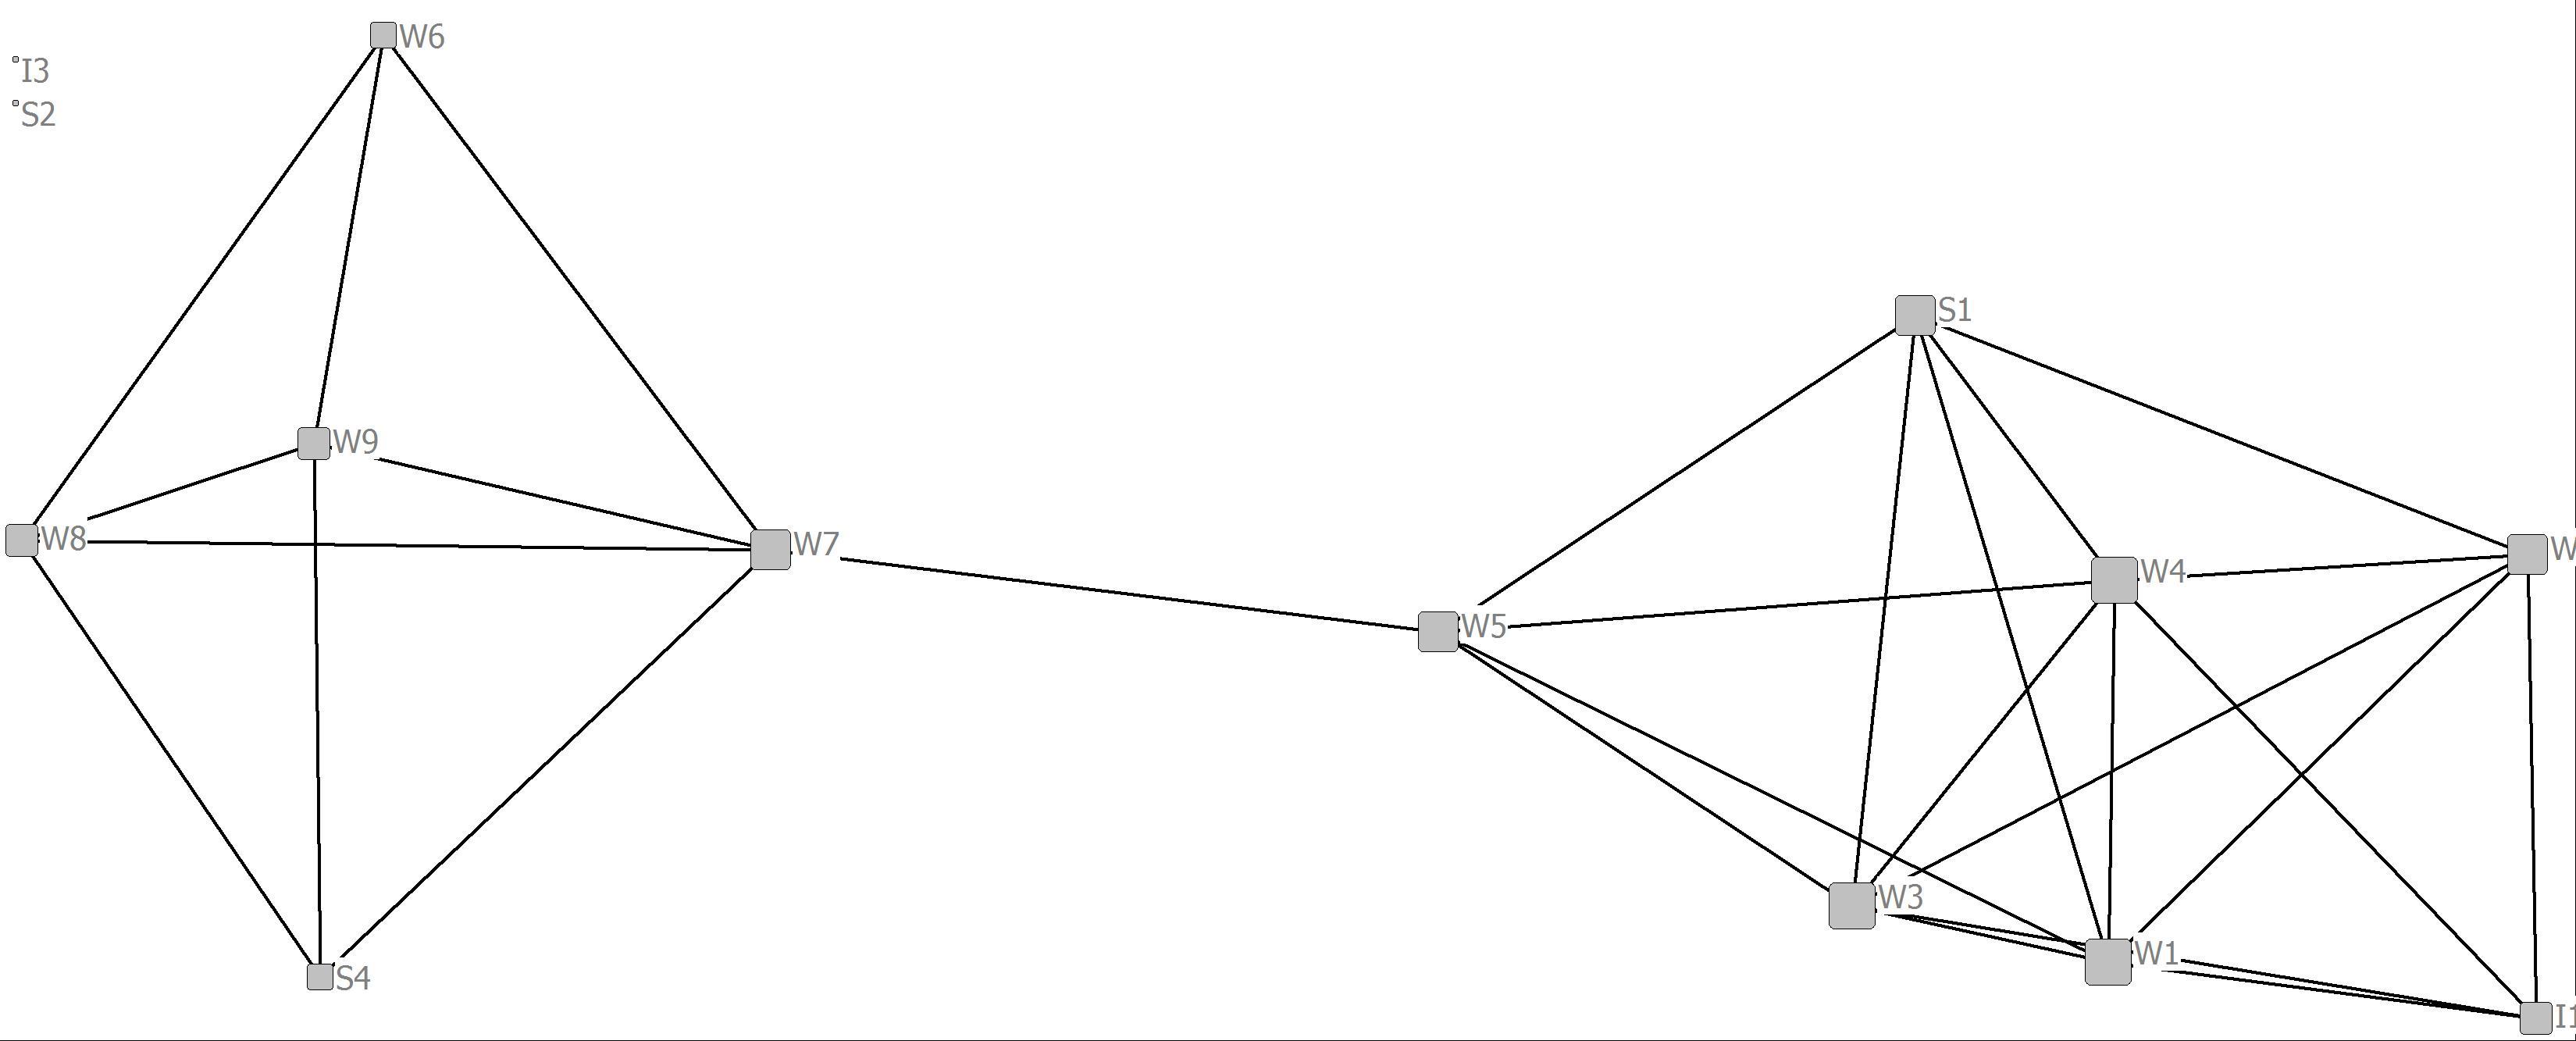
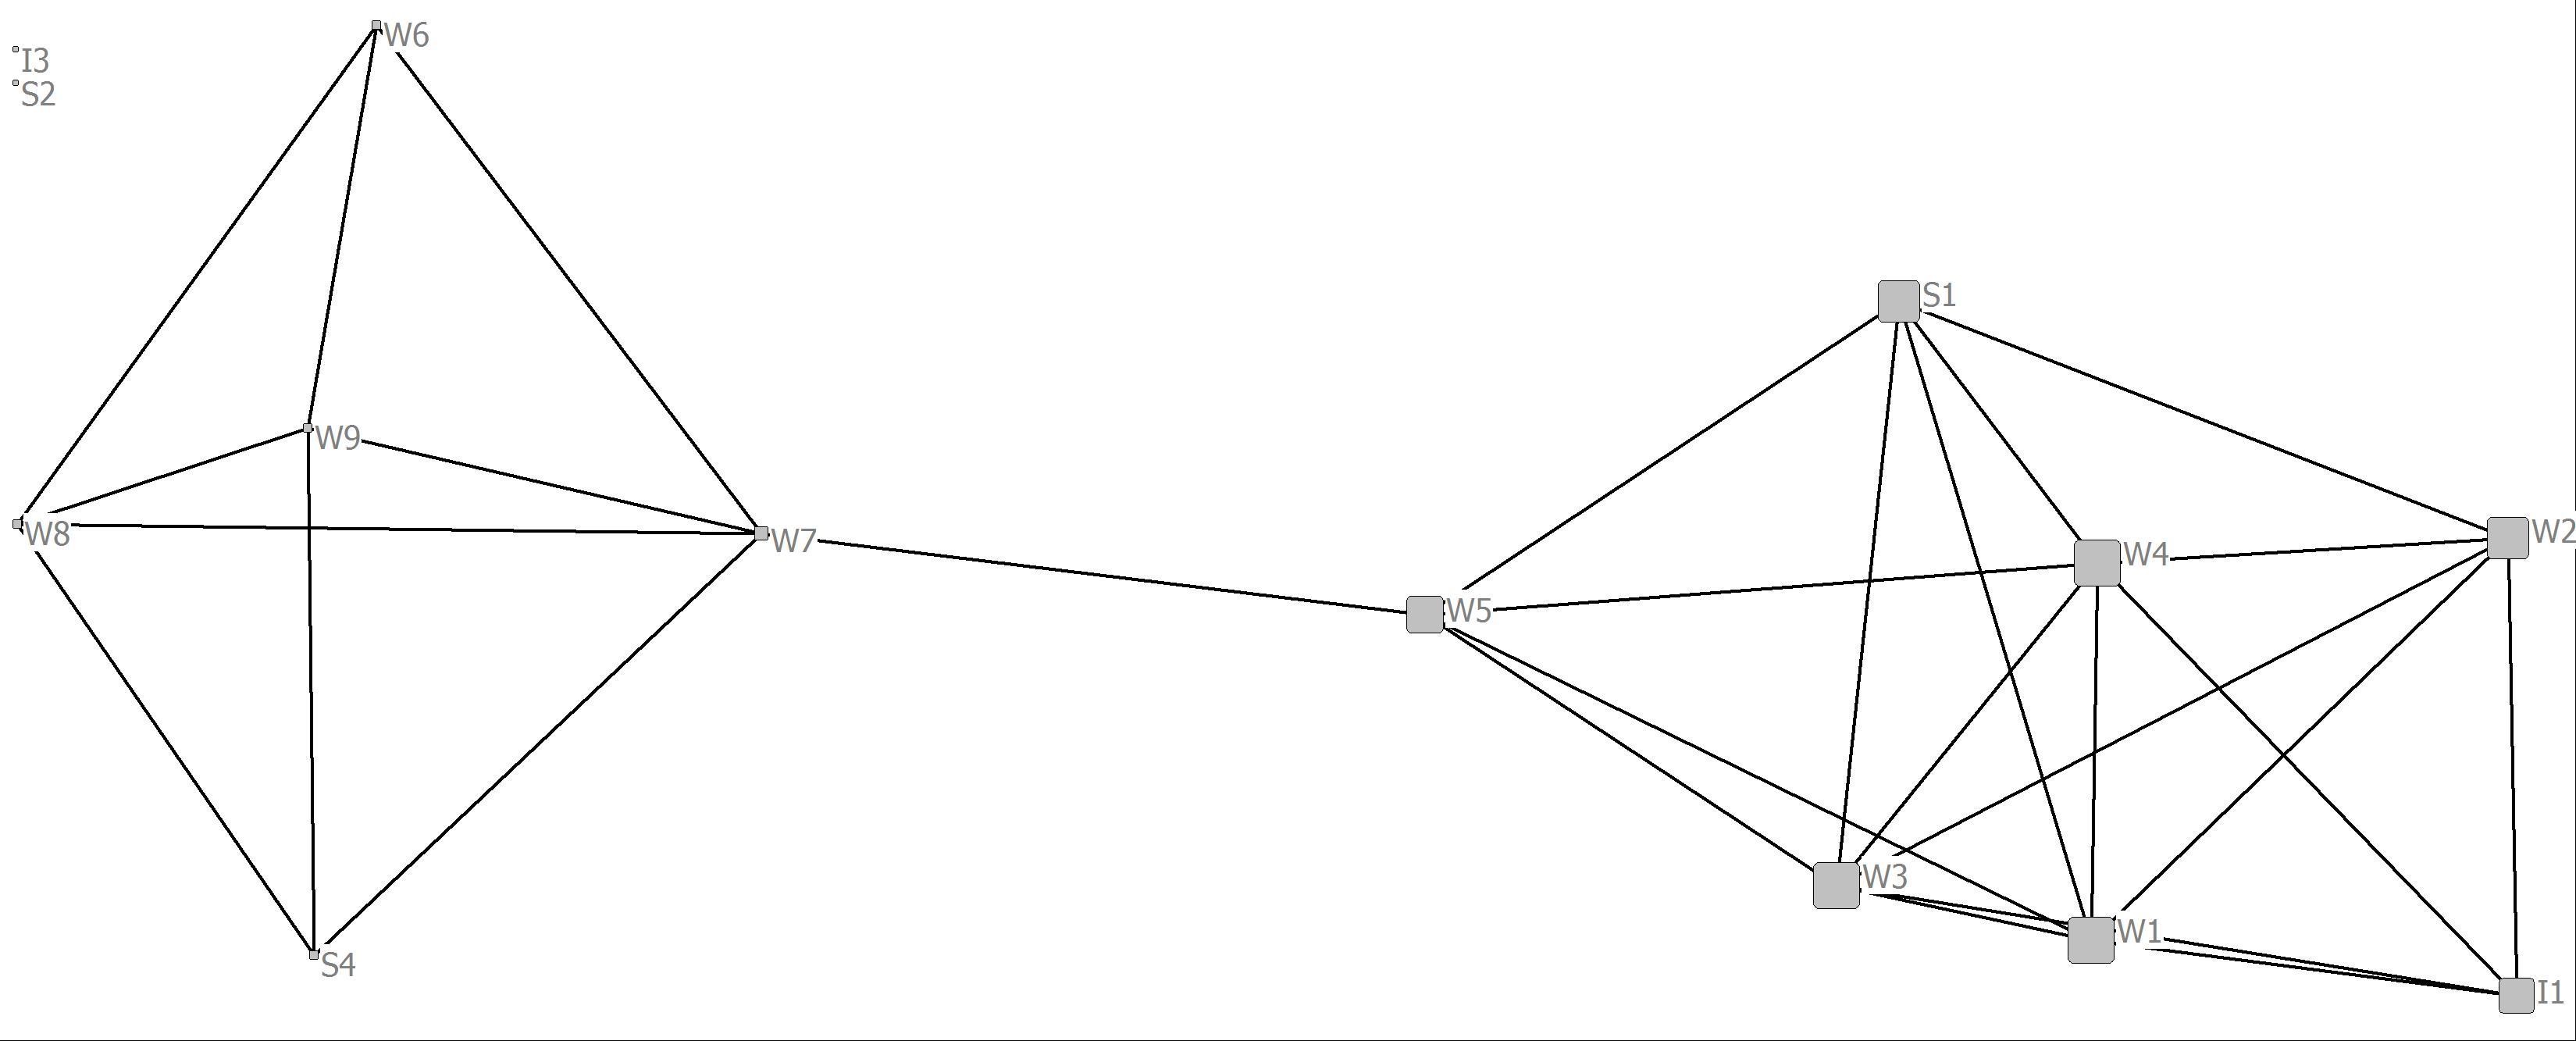
3. Create four visualizations of the bank wiring room game network. In each of the visualizations make the size of the nodes proportional to the value of each of the four centrality measures. Compare and contrast the differences and similarities of the measures across the four visualizations. From a social and behavioral perspective how might you interpret these comparisons?
Whereas the degree and closeness centrality analyses are somewhat similar the eigenvector and betweenness analyses reveal important structural characteristics of some of the nodes. In the case of eigenvector centrality, power is more concentrated in the cluster to the right in that more highly central nodes are connected to other central nodes. For betweenness centrality, clearly actor’s W7 and W5 are in brokering positions in that they connect two distinct clusters in the network. We can also think of them as having higher social capital.
Degree Centrality
Closeness Centrality
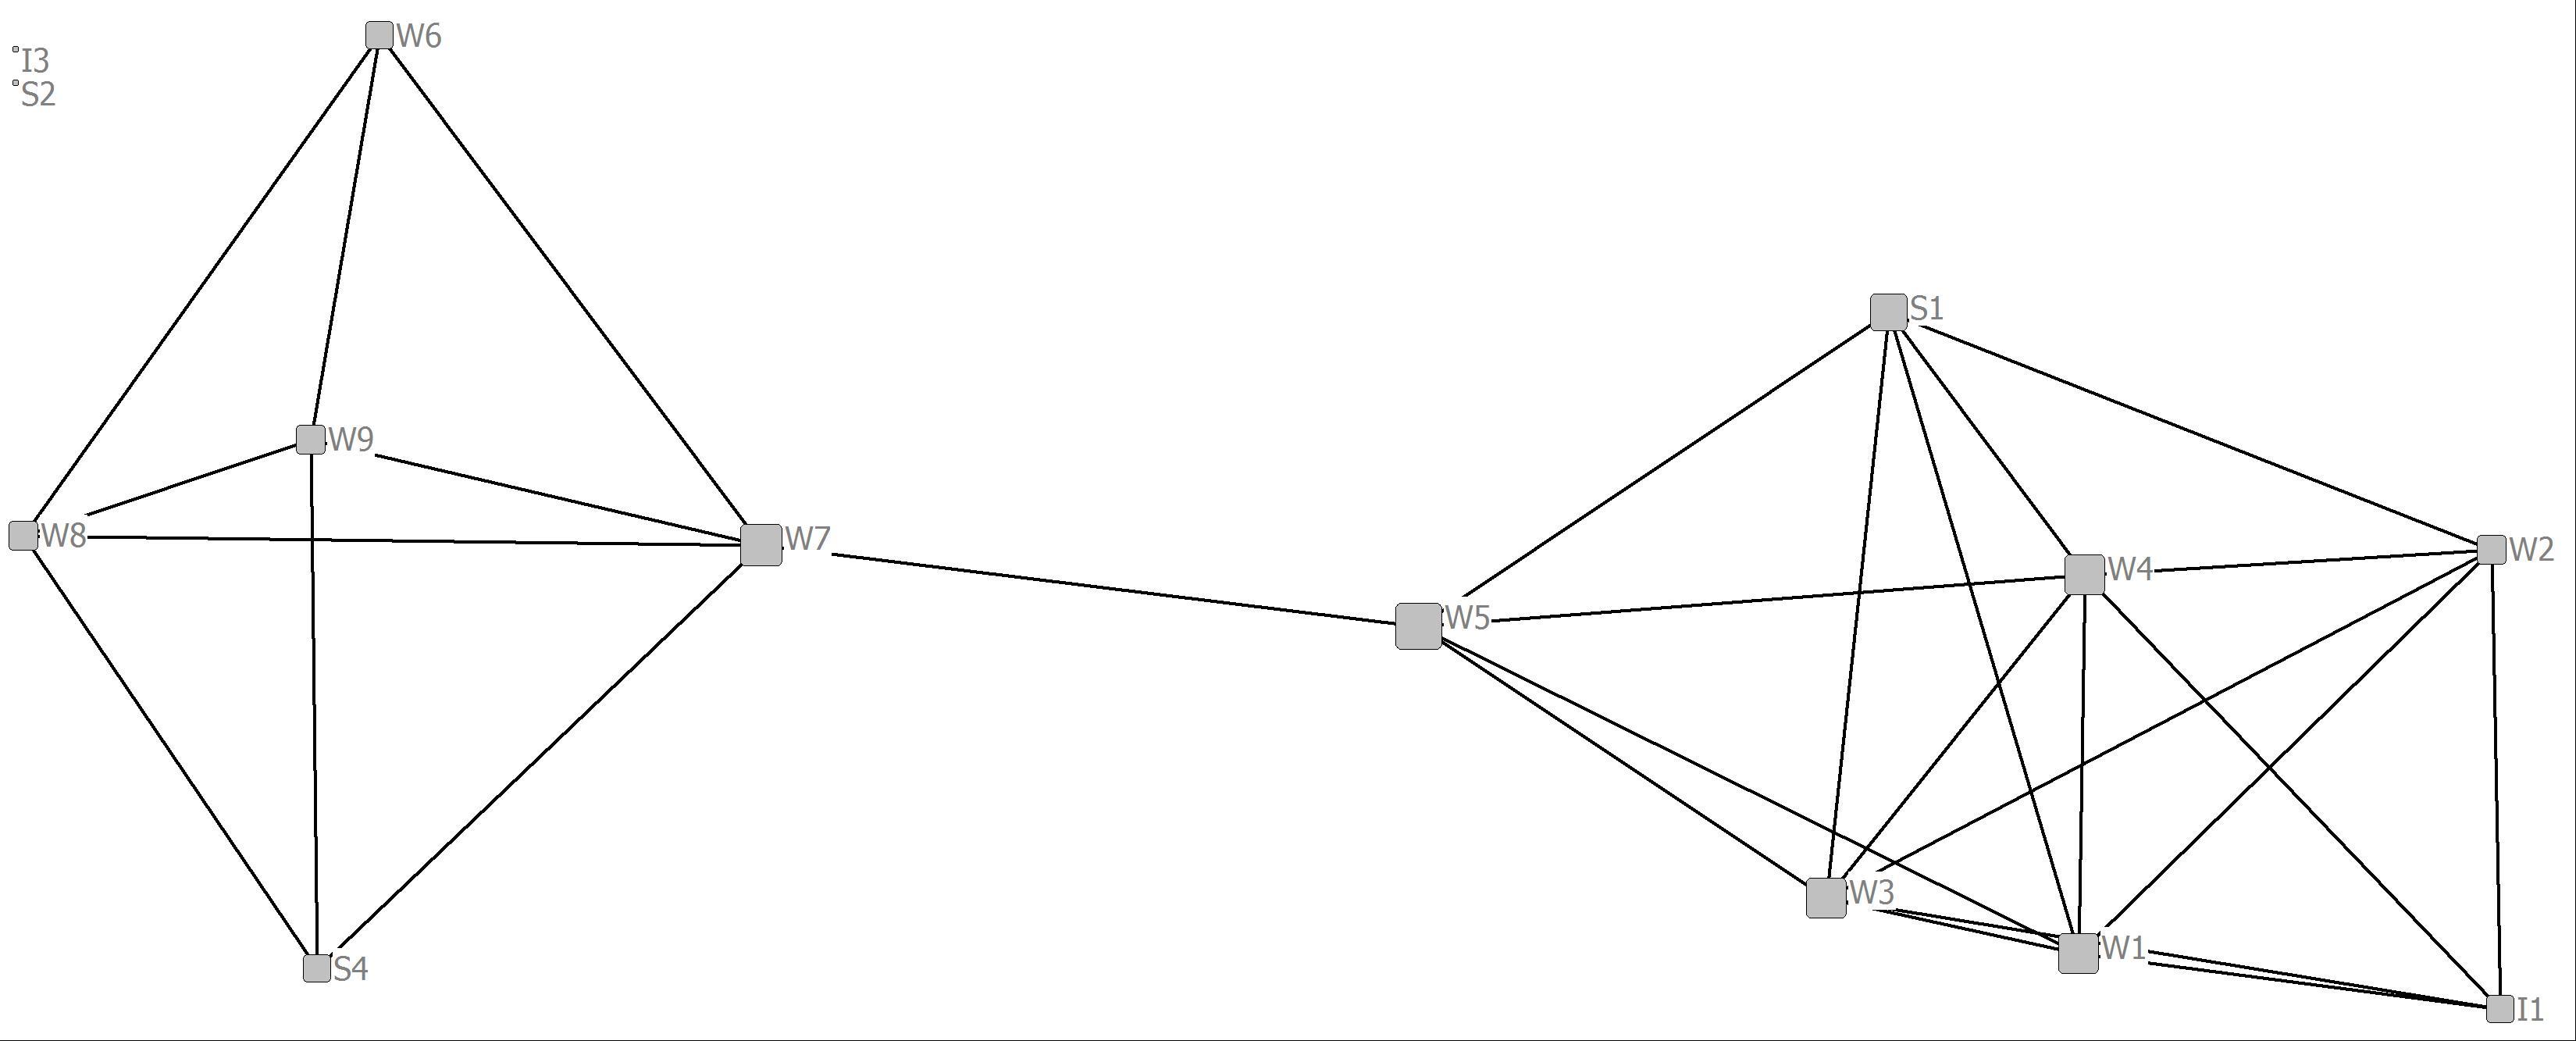
Eigenvector Centrality
Betweenness Centrality
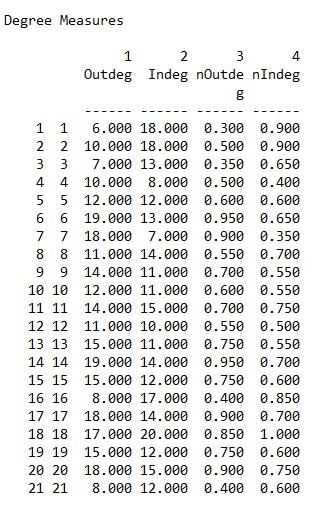
4. Using the advice relations among actors in Krackhardt’s advice network (KRACKAD.##h) provide an analysis of node centrality for each of the measures below. The network is a directed dichotomous network.
EXERCISES NOTE: The KRACKAD network used for problems in Chapters 5 and 10 are not the same in the KRACKAD in the UCINET standard datasets.
a. Degree Centrality in a directed network (in UCINET go to Network|Centrality and Power|Degree. Given this is a directed network “Directed” must be highlighted at the far left. Upload the network and click OK. Make sure to note the names of the output files).
Degree centrality output
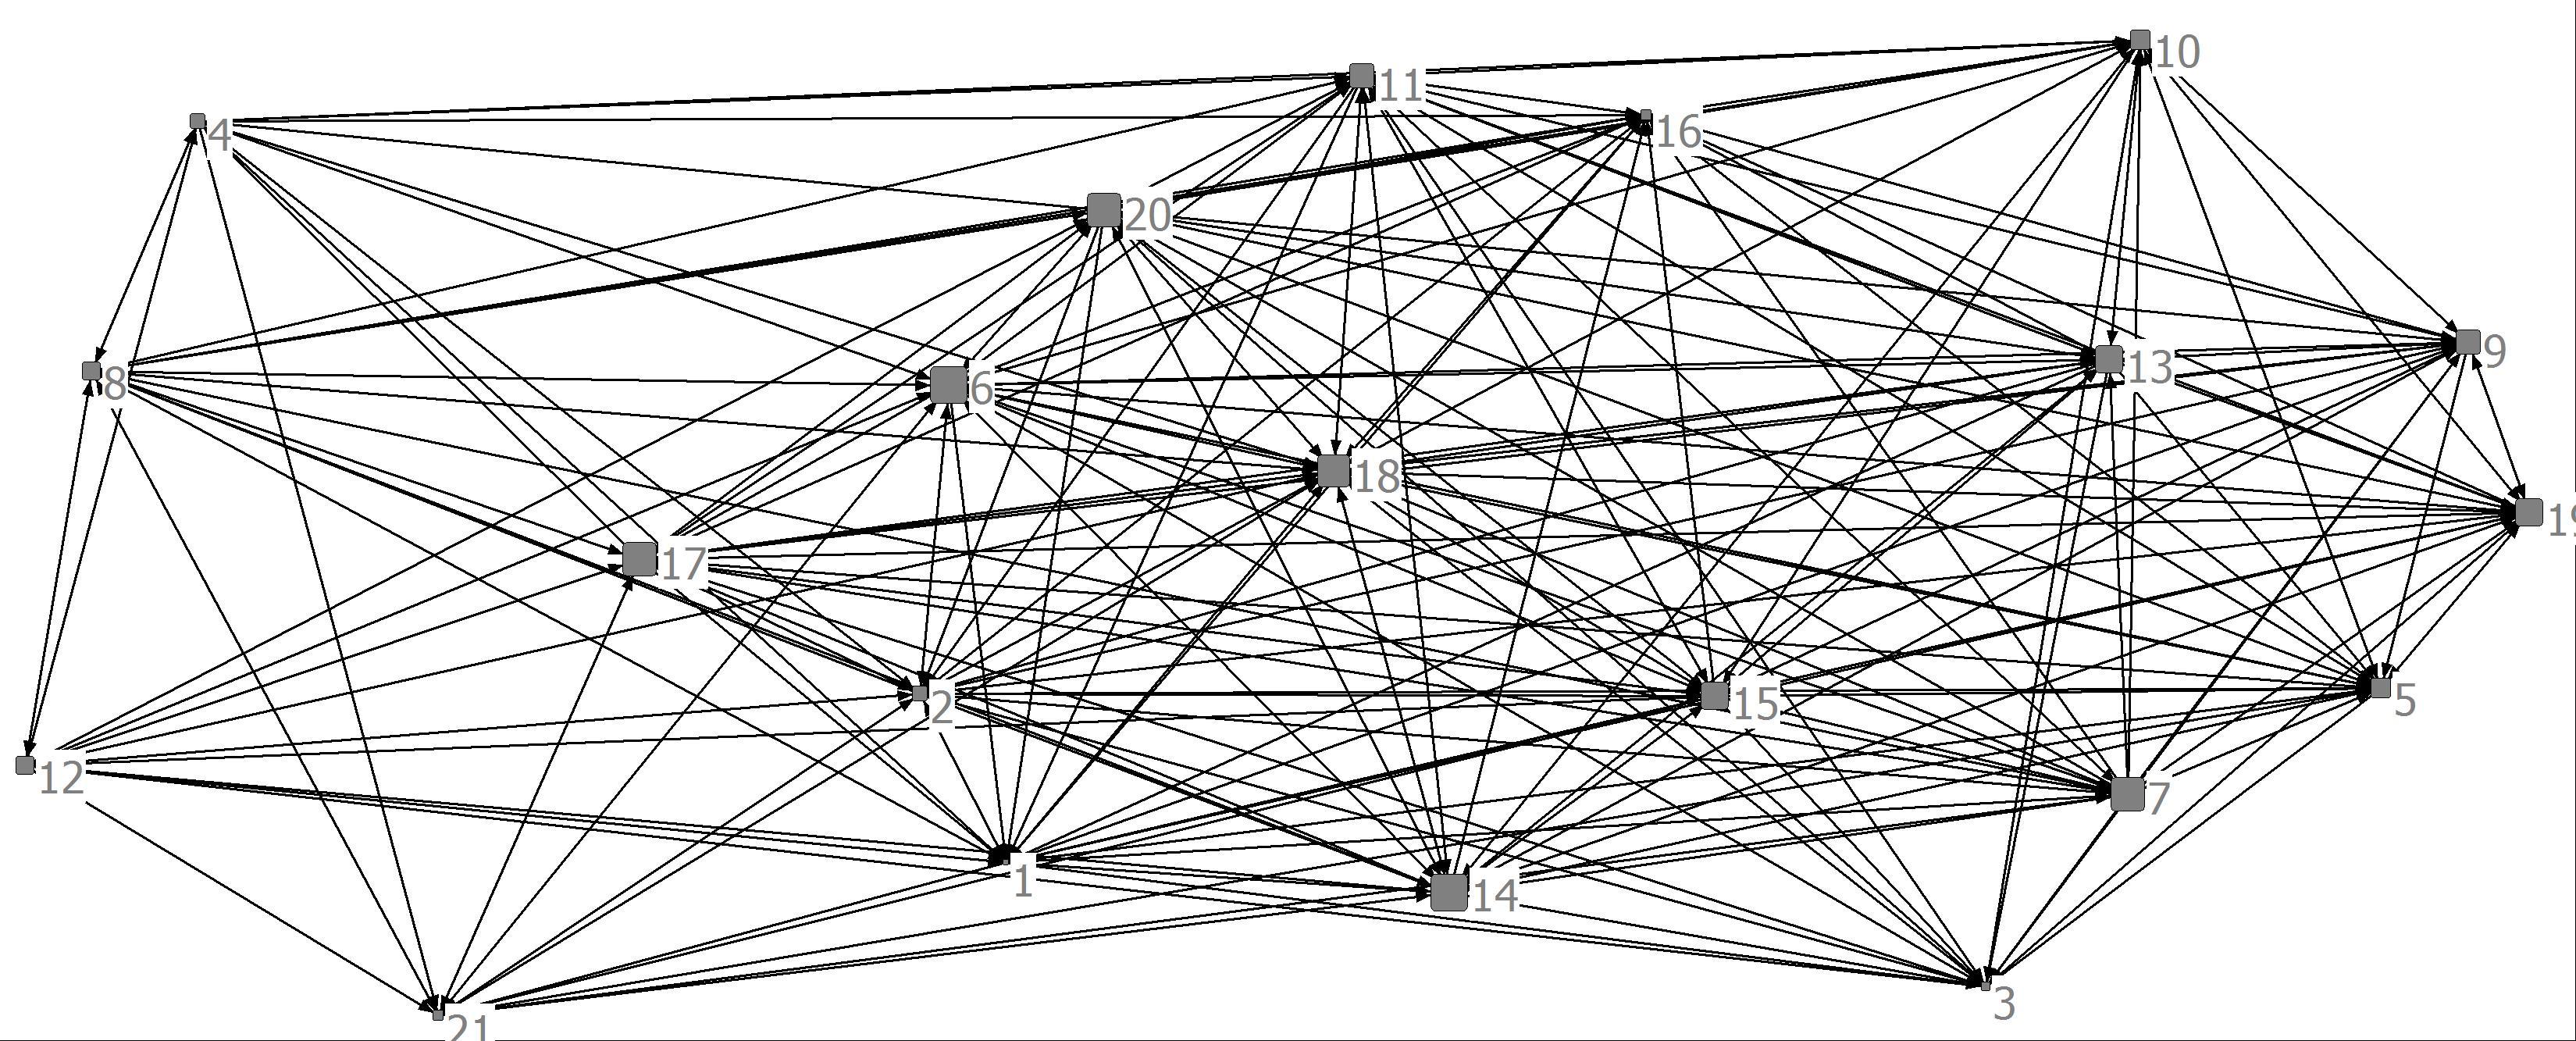
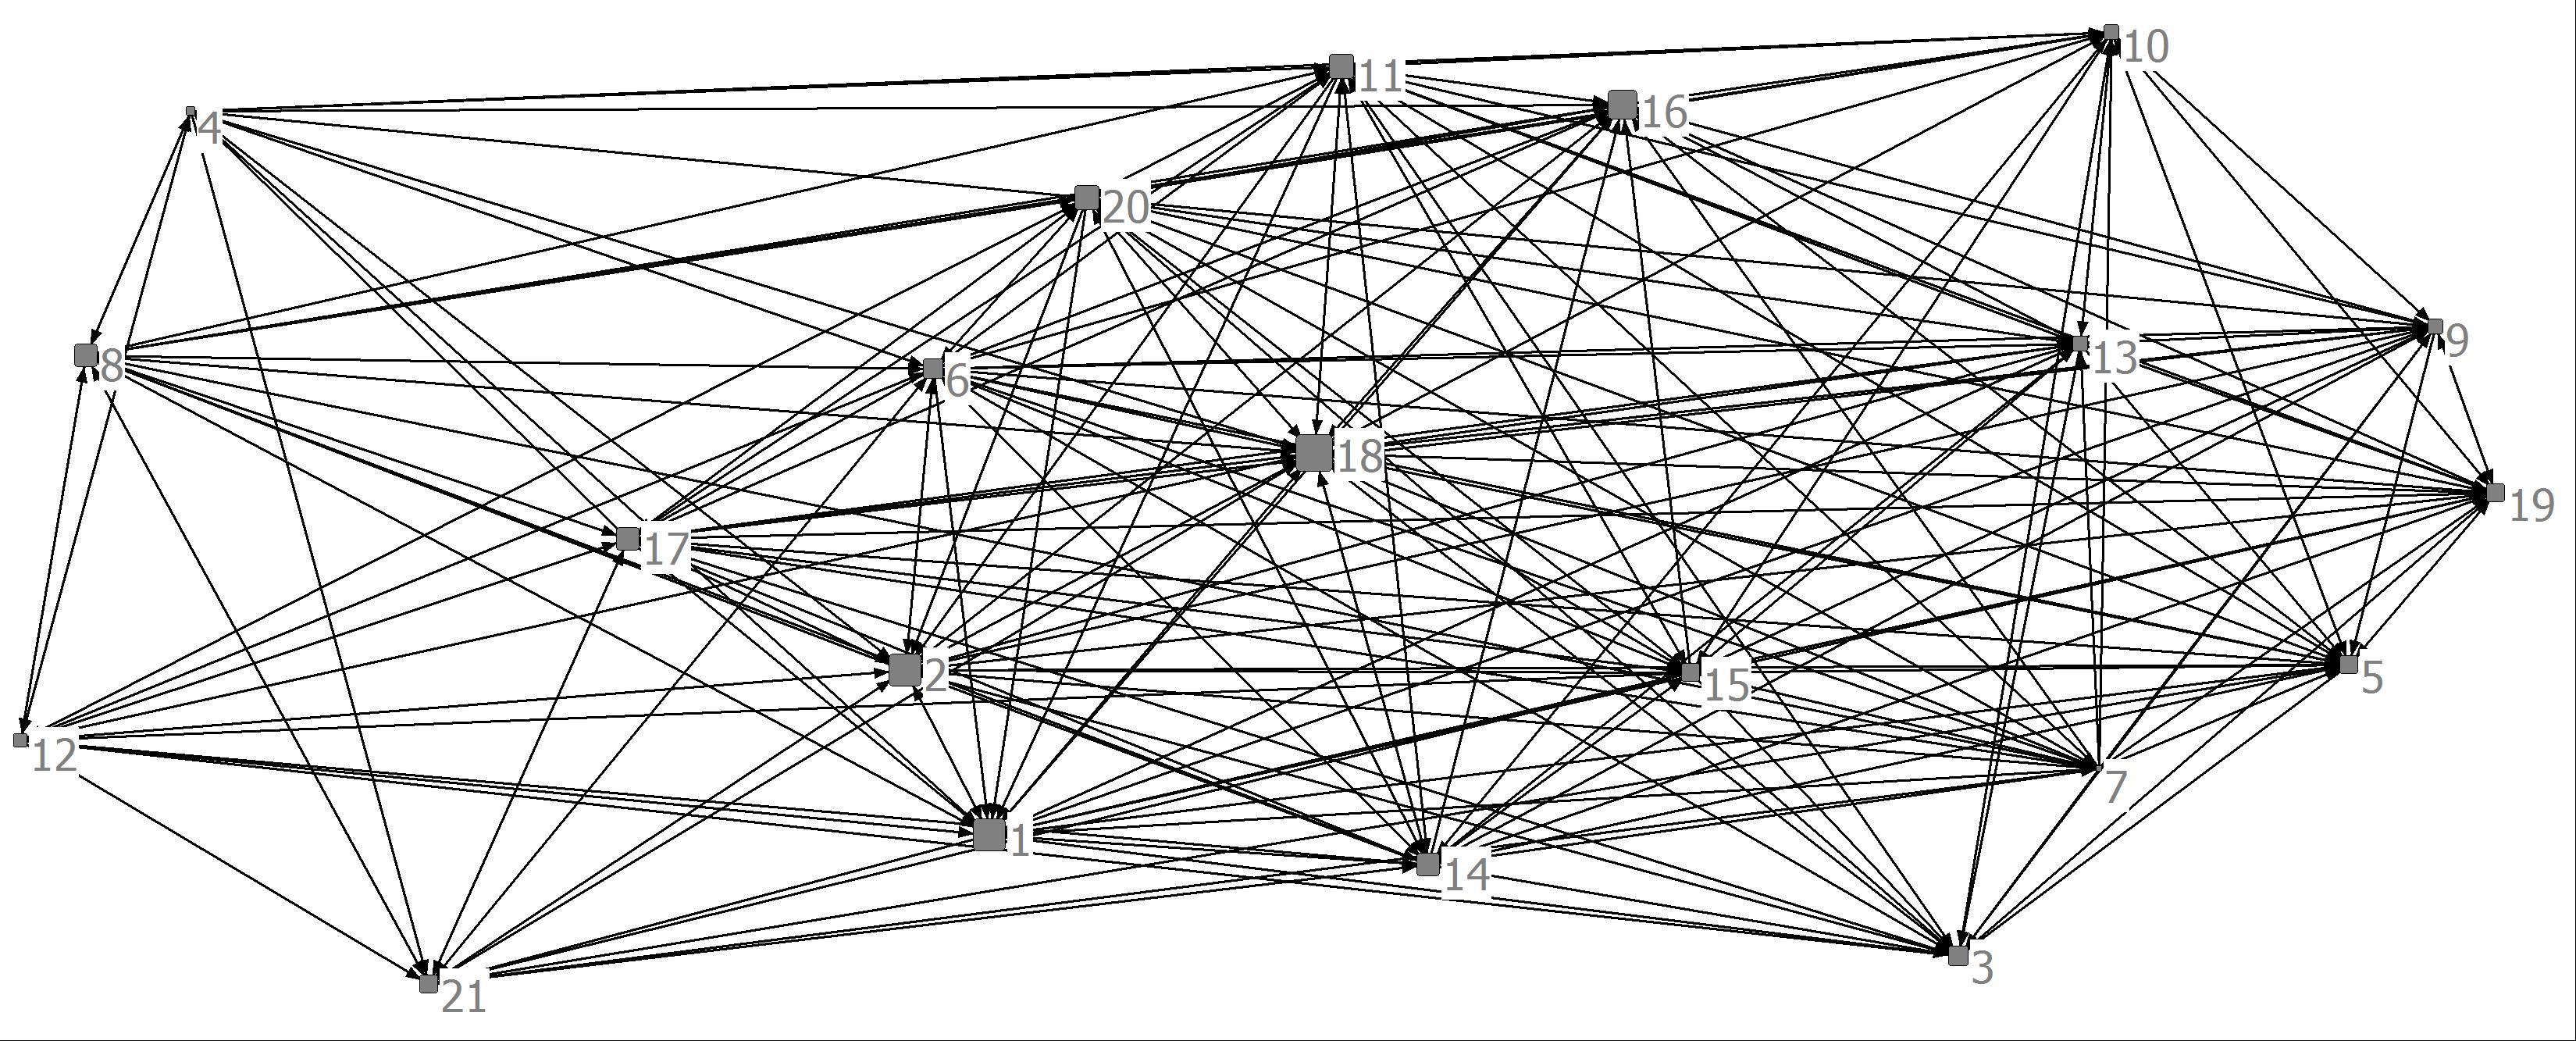
b. As in Problem 3 above, create two visualizations of the advice network with one having a node size proportional to indegree centrality and one with a node size proportional to outdegree centrality.
Advice Outdegree
Advice Indegree
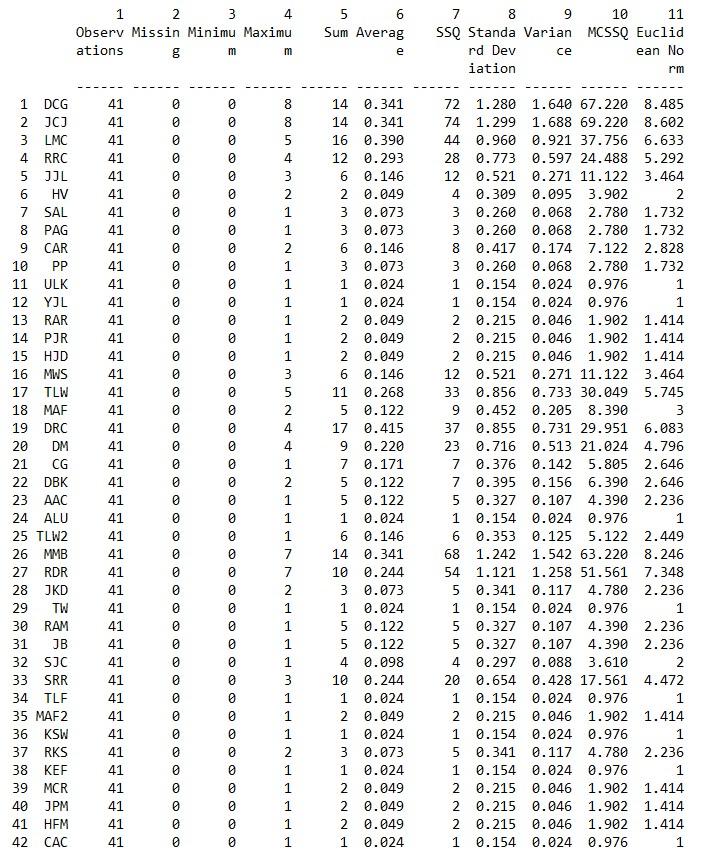
5. The science collaboration network used in Chapter 6 is a symmetric valued network reflecting the number of grants researchers have in common. Provide an analysis of node centrality in this valued symmetric network for each of the following centrality measures.
a. Degree Centrality (in UCINET go to Tools|Univariate statistics and input the collaboration network. Note the name of the output file)
Degree centrality for a valued graph (look at the row sums for each scientist)
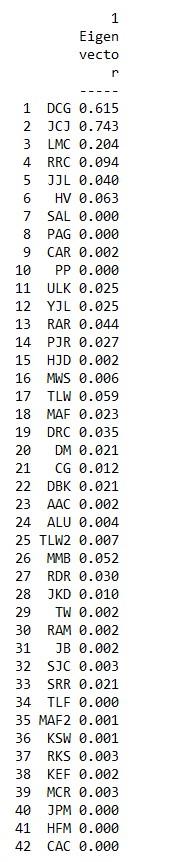
b. Eigenvector Centrality (in UCINET go to Network|Centrality and Power|Eigenvector Centrality. Upload the network and click OK. Make sure to note the names of the output files).
Eigenvector centrality
c. Create three visualizations of the scientific collaboration network with one having a node size proportional to the average row sum, one with a node size proportional to the row sum and one with a node size proportional to eigenvector centrality.
Row Average
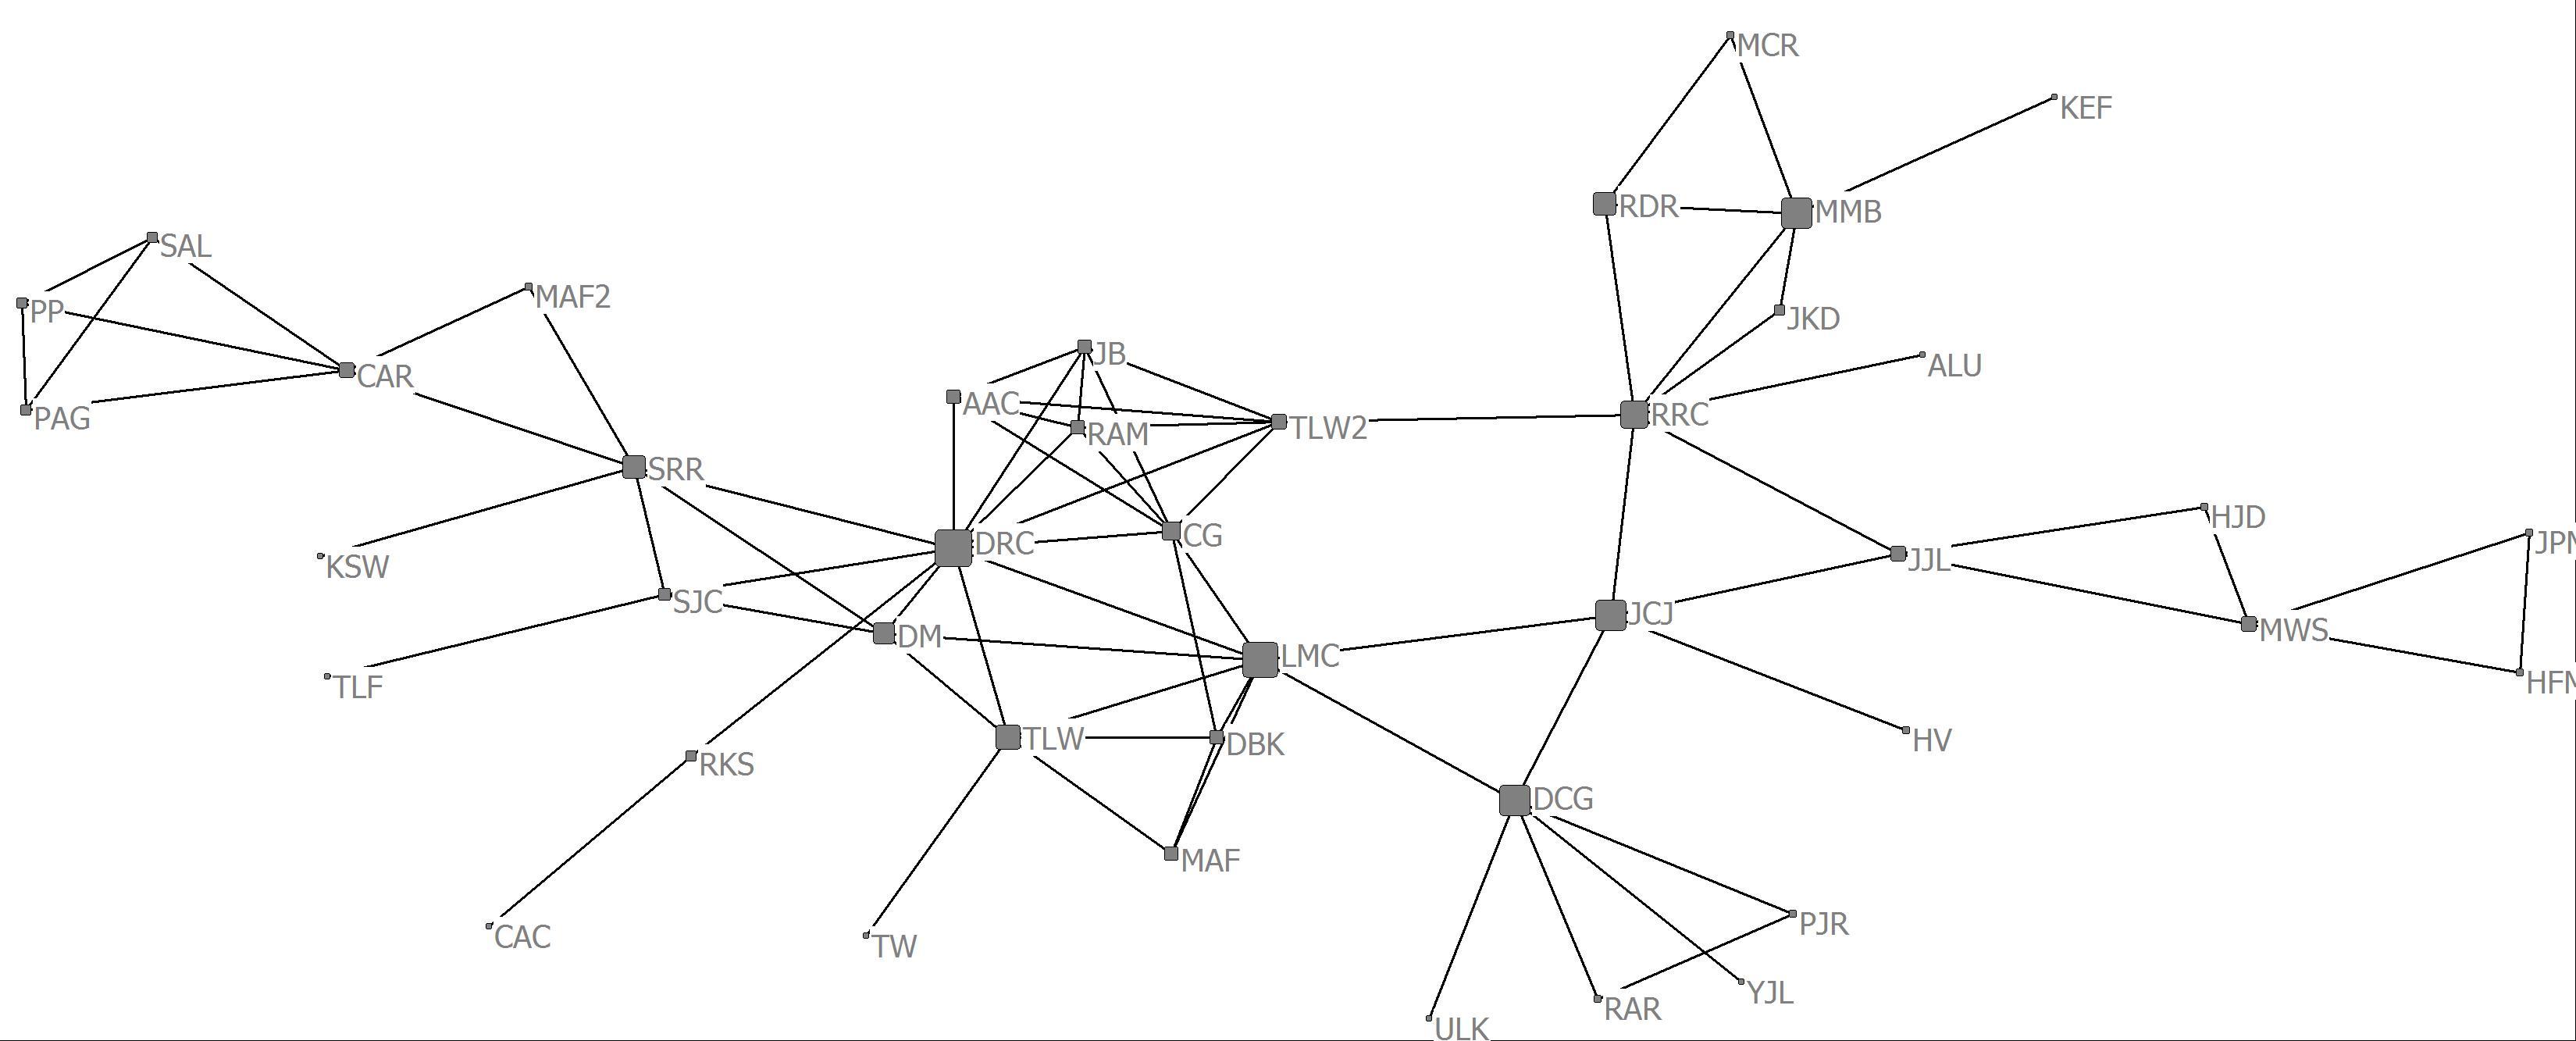
Row Sum
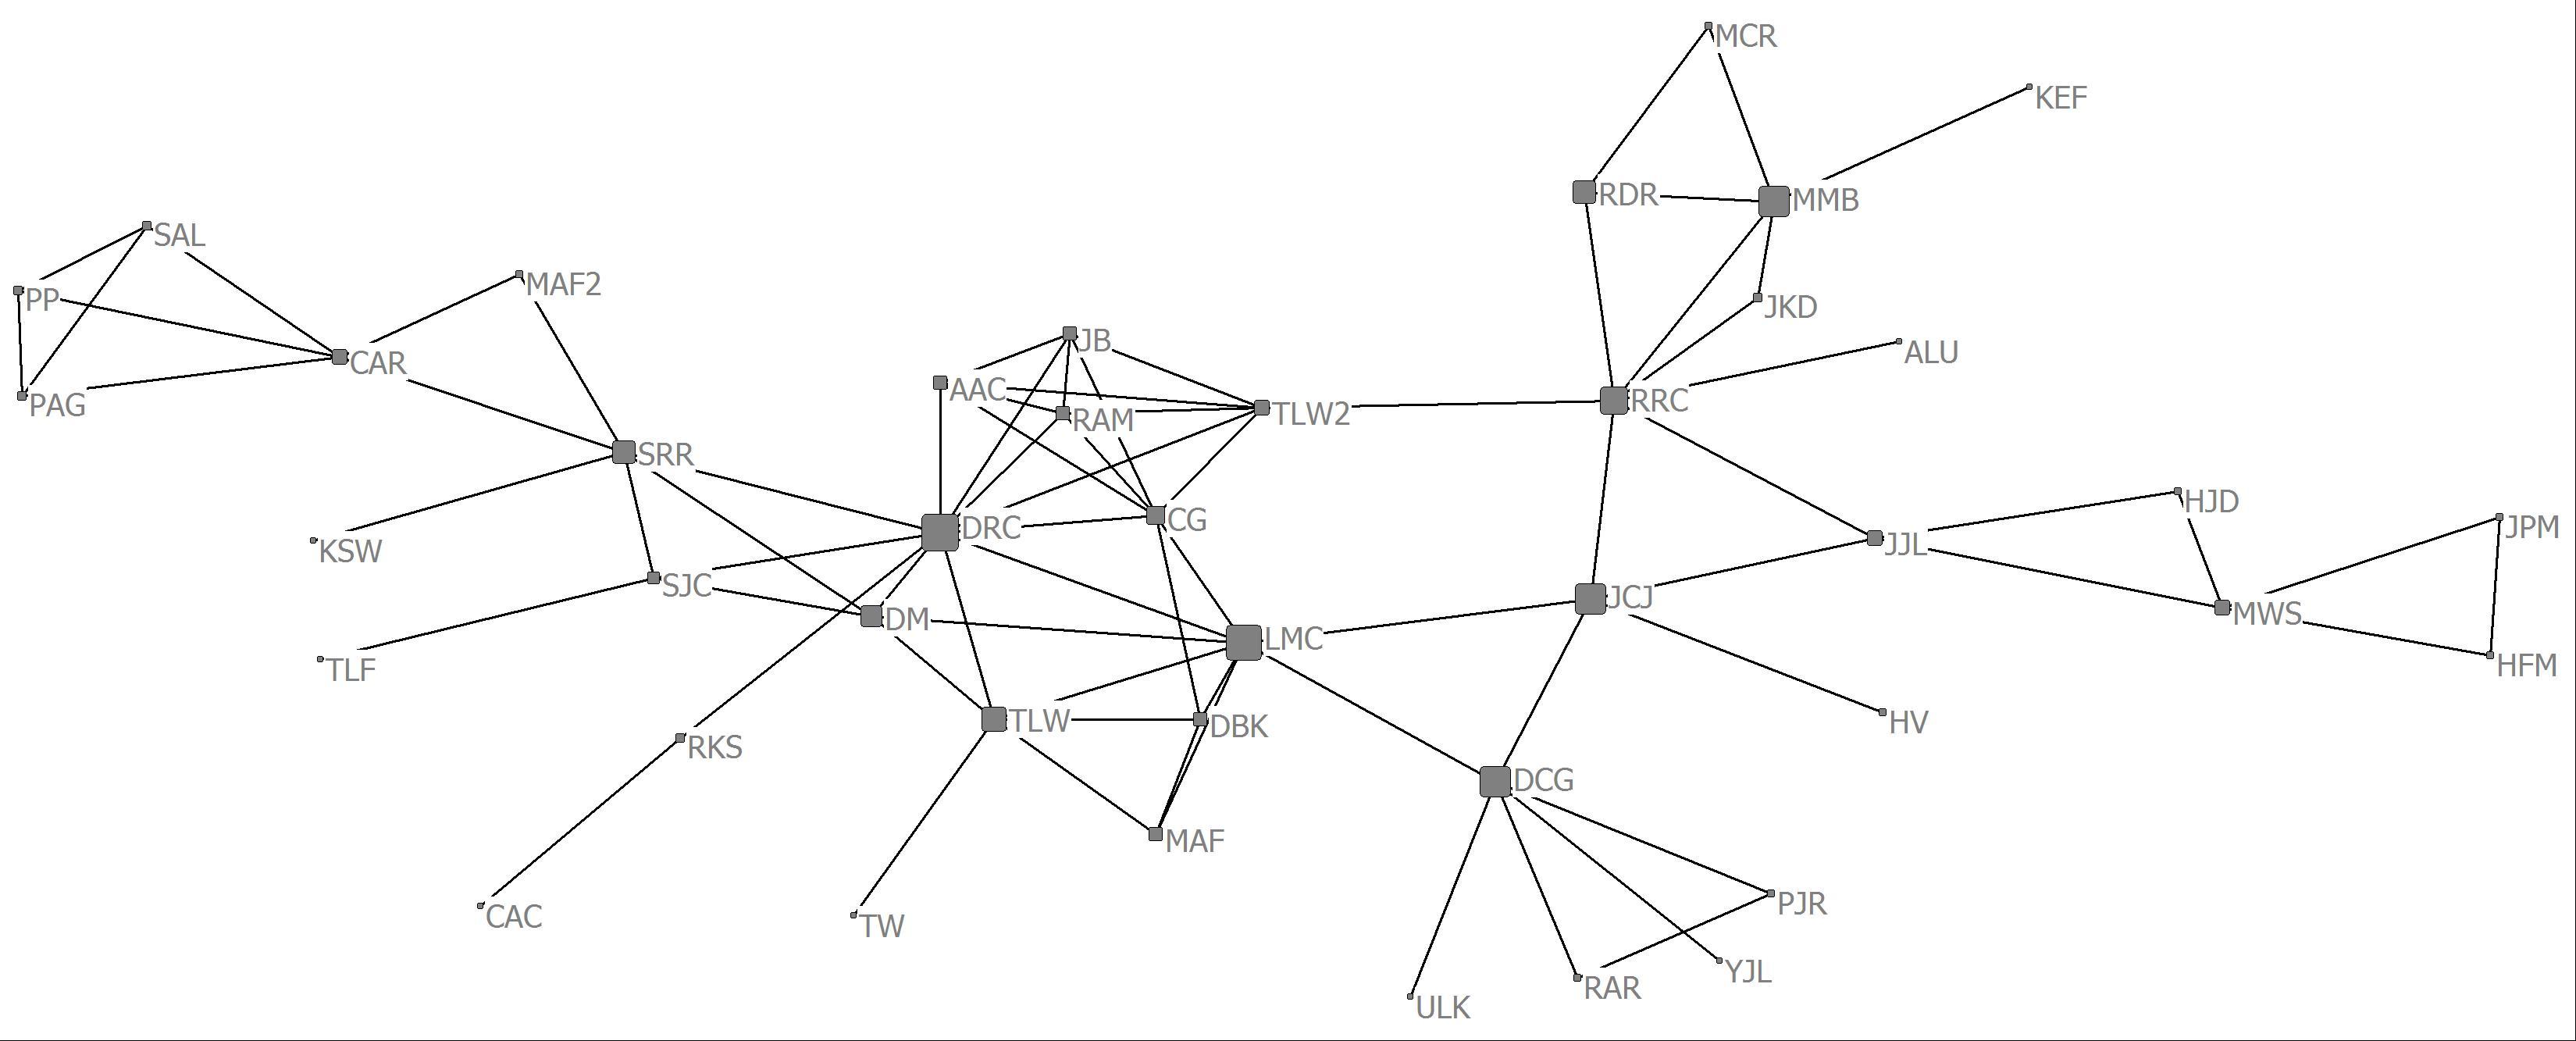
Eigenvector