Analyzing Social Networks
Chapter 14: Large Networks
14.7 Problems and Exercises
› Click here to download corresponding data
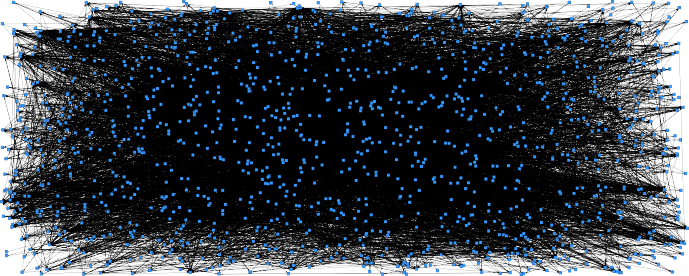
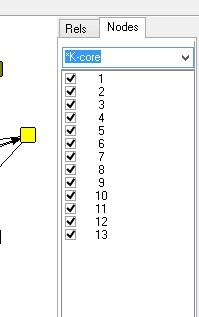
1. One way of reducing complexity of the problem in large networks is to use K-Cores. The network file “Antarctica.##h” involves relationships among Wikipedia pages that contain the word “Antarctica”. The network contains 1337 nodes. First, visualize the network. In NetDraw go to File|Open|Ucinet dataset|Network and load Antarctica.##h and click OK (it may take a while to load). It is hard to see anything because of the sheer size of the network and the overlapping labels. To toggle off the labels go up to the “L” in the icon menu across the top and click. Click the green check mark to toggle off the labels. It is still very difficult to understand the network. To do an analysis of K-cores in NetDraw go to Analysis|K-cores and click on K-cores. The nodes will change various colors reflecting K-core membership. To view the core nodes, click on the “Nodes” tab in the right corner. In the pull-down menu select K-cores. Uncheck boxes 1 through 11. This now leaves the most central nodes in the network. We can now add the labels for interpretation. Click on the “L” to toggle on the labels. Can you now interpret relationships among the nodes?
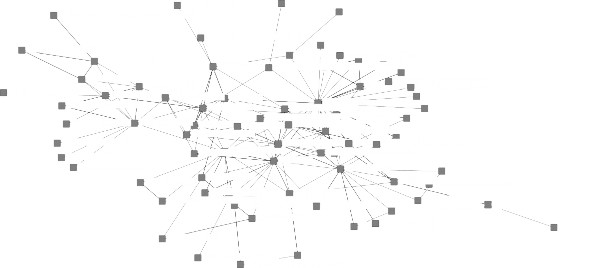
Obviously, this network is extremely complex and difficult to interpret. However, by using K-cores the complexity of the network can be reduced by pruning some of the less central nodes. The K-cores analysis for the Antarctic network shows only nodes with a degree of 12 or more. The network can now be more readily interpreted once the lesser degree nodes have been pruned.
Antarctic complete network
Selecting the core
Core Nodes (K > 11)
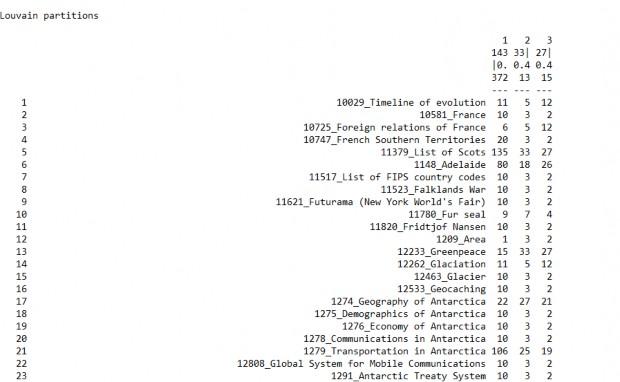
3. Run the Louvain method for community detection on the Antarctica data. Compare your results with the K-cores found in Question 1.
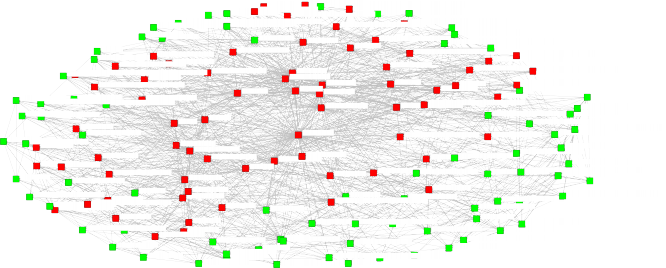
In UCINET got to Network|Subgroups|Louvain method. Load in the Antarctica network and click OK. Just as the various K-cores can be visualized to reduce network size, the various clusters identified in the Louvain community detection method can be visualized individually or in combination with other clusters.
Louvain Results for the Antarctica Network
A cluster from the Louvain Community Detection Method (mostly a cluster of more ecological terms).