Analyzing Social Networks
Chapter 5: Data Management
5.11 Problems and Exercises
(Note: Problems in the chapters to follow will be using UCINET and E-Net for the problems and exercises. Exercise datasets and help with using UCINET can be found at https://study.sagepub.com/borgatti2e)
› Click here to download corresponding data
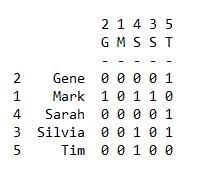
1. Below is social network data collected from members of a book club at a university on who talks to whom about school-related matters. Format the data in each of the following ways:
-
A text file using the DL description language in a nodelist1 format. Import the DL text file into UCINET using Data|Import text file|DL.
-
Enter the data in the UCINET DL Editor in edgelist1 format and save as a UCINET data file (in the DL Editor save using the “Edgelist1 ego alter” in the “Data format” menu.)
-
Enter the data in a nodelist1 format in Excel and import the data into UCINET using the DL Editor (in the DL editor open the Excel file and save the file as a UCINET data file using the “Nodelist2 (woman event1 event2 ...)” in the “Data format” menu.)
Data:
Mark reports he talks to Gene, Silvia, and Sarah
Gene reports he talks to Tim
Silvia reports she talks to Tim and Sarah
Sarah reports she talks to Tim
Tim reports he talks to Sarah
dl n=5
format=nodelist1
labels embedded
data:
Mark Gene Silvia Sarah
Gene Tim
Silvia Tim Sarah
Sarah Tim
Tim Sarah
Results
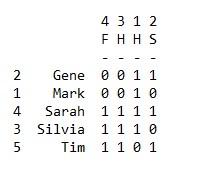
2.In addition to the one-mode social network data above, two-mode data were also collected on what university events each had attended over the last 6 months. Format the data in each of the following ways:
-
A text file using the DL description language in a nodelist2 format. Import the DL text file into UCINET using Data|Import text file|DL.
-
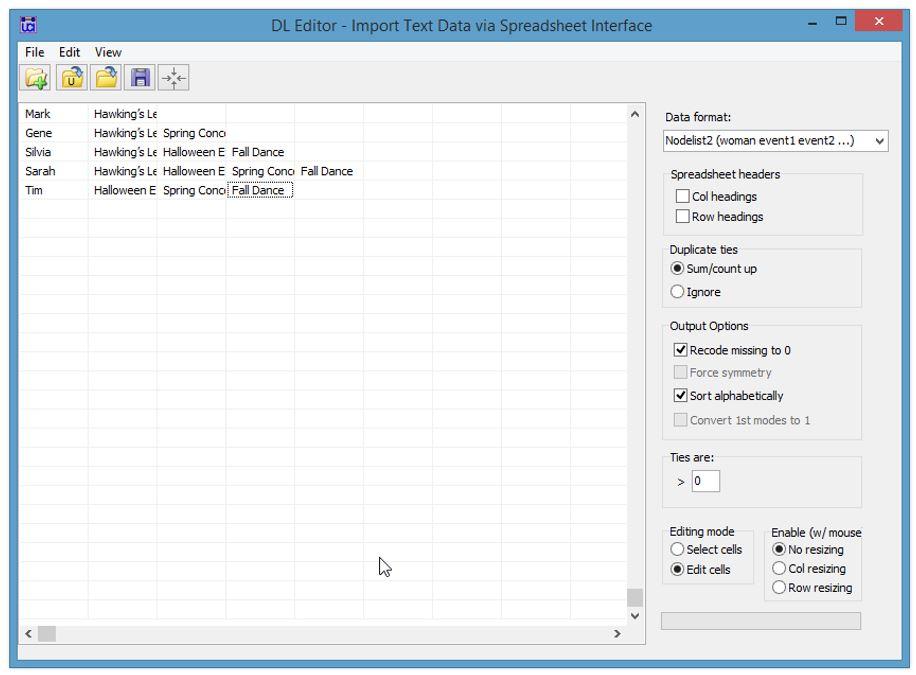
Enter the data in a nodelist2 format in Excel and import the data into UCINET using the DL Editor (in the DL editor open the Excel file and save the file as a UCINET data file using the “Nodelist2 (ego alter1 alter2 ...)” in the “Data format” menu.)
The student by events data in the DL Editor
Data:
Mark went to Hawking’s Lecture
Gene went to Hawking’s Lecture and Spring Concert
Silvia went to Hawking’s Lecture, Halloween Event and Fall Dance
Sarah went to Hawking’s Lecture, Halloween Event, Spring Concert, and Fall Dance
Tim went to Halloween Event, Spring Concert, and Fall Dance
dl nr=5, nc=4
format = nodelist2
row labels embedded
column labels embedded
data:
Mark Hawkings_Lecture
Gene Hawkings_Lecture Spring_Concert
Silvia Hawkings_Lecture Halloween_Event Fall_Dance
Sarah Hawkings_Lecture Halloween_Event Spring_Concert Fall_Dance
Tim Halloween_Event Spring_Concert Fall_Dance
Results
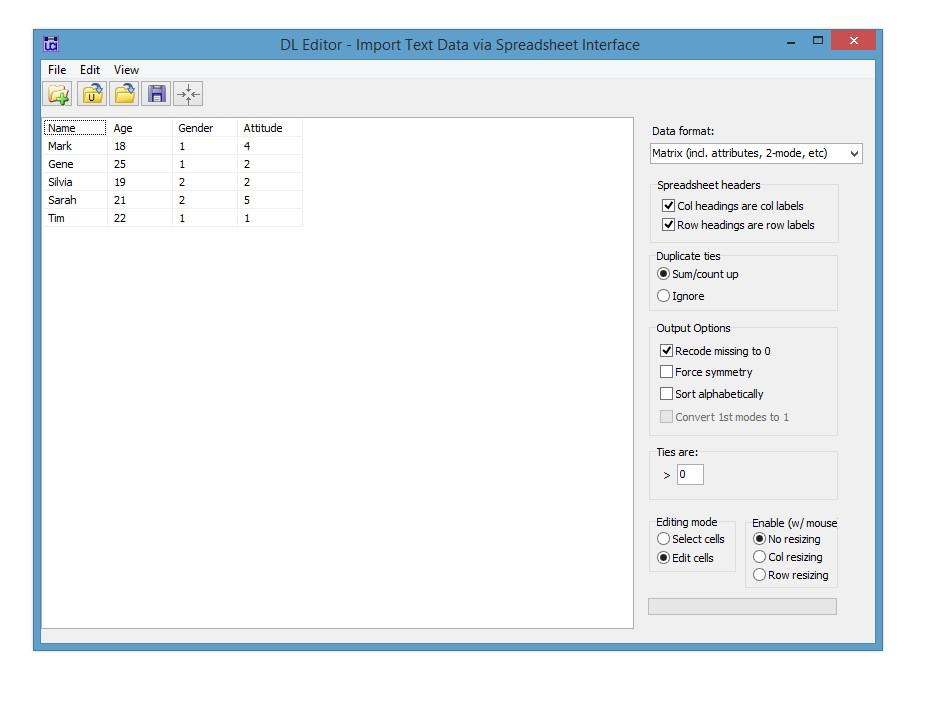
3. Demographic and attribute data were also collected. Data includes age, gender and attitude towards premarital sex on a Likert scale from 1 to 5 (ranging from 1 being against and 5 for). Enter the data in a matrix format in Excel and import the data into UCINET using the DL Editor (in the DL editor open the Excel file and save the file as a UCINET data file using the “Full Matrix” in the “Data format” menu.)
Data:
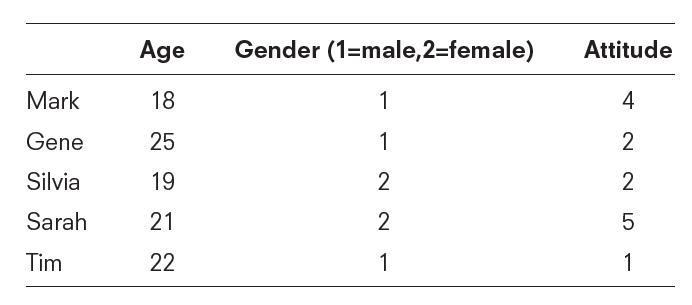
Excel entries

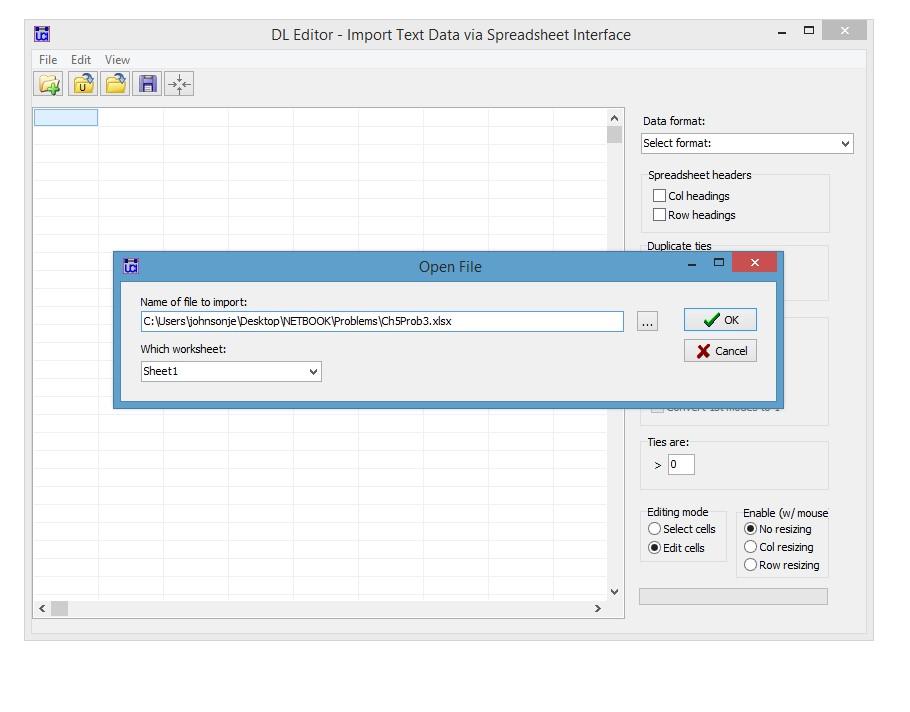
Importing the Excel file to the DL editor
Attribute data opened in DL Editor
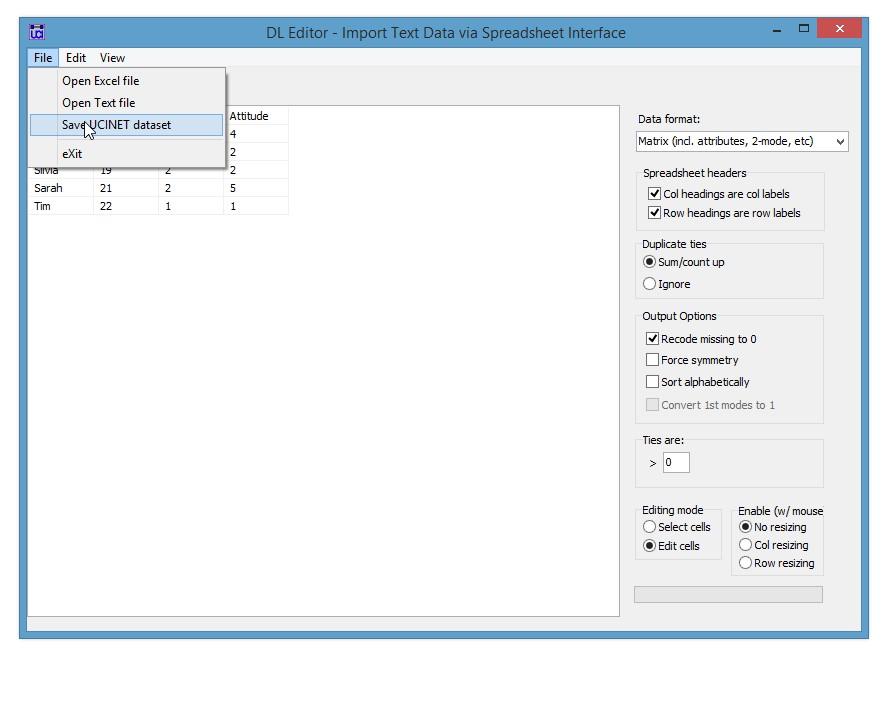
Saving the data to a UCINET dataset
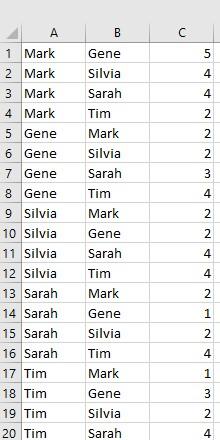
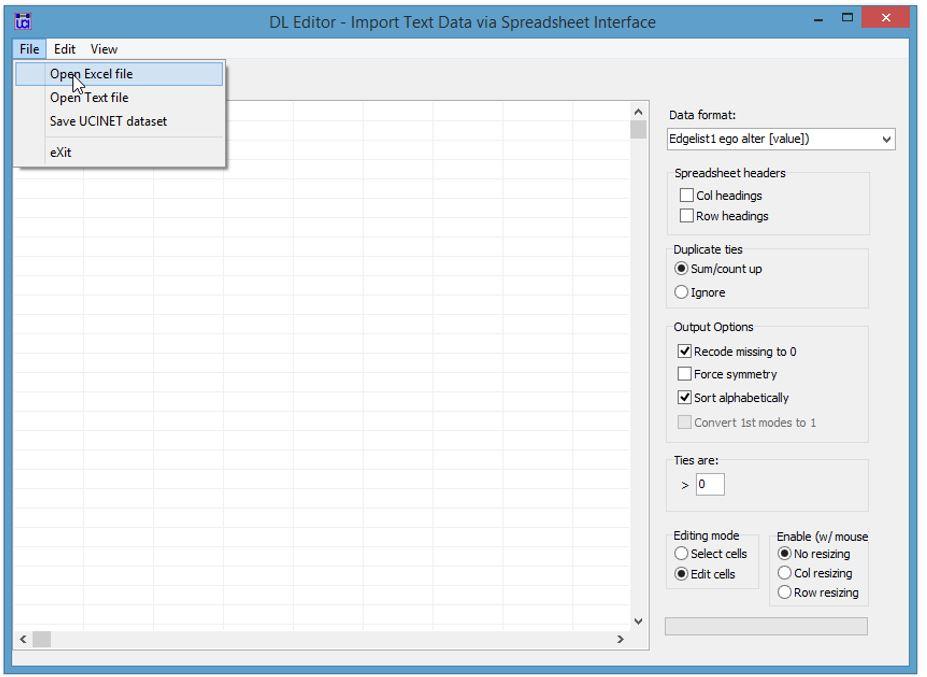
4. Finally, the students were asked to rate ‘how much they interacted socially’ with the other students over the last two weeks on a 5-point Likert scale with 1 being very little and 5 being a great deal. Enter the data in a matrix format in Excel and import the data into UCINET using the DL Editor (in the DL editor open the Excel file and save the file as a UCINET data file using the “Edgelist1 ego alter [value])” in the “Data format” menu.)
Data:
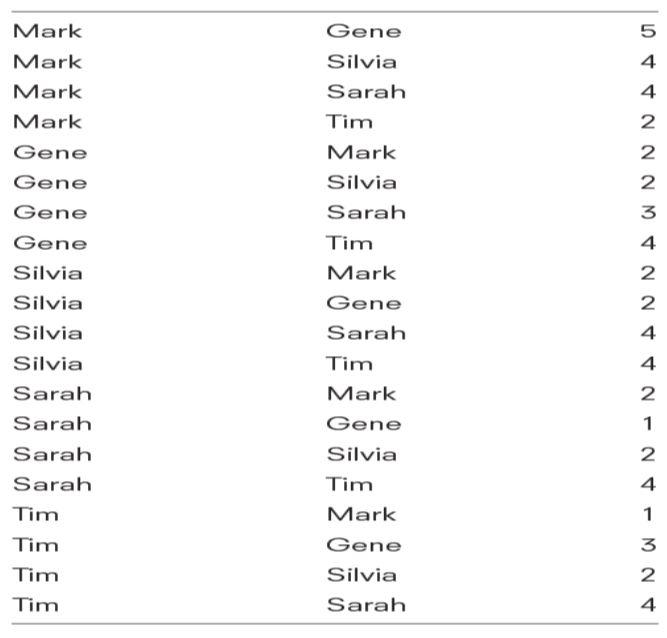
The Excel file
Go into the DL Editor and open the Excel file
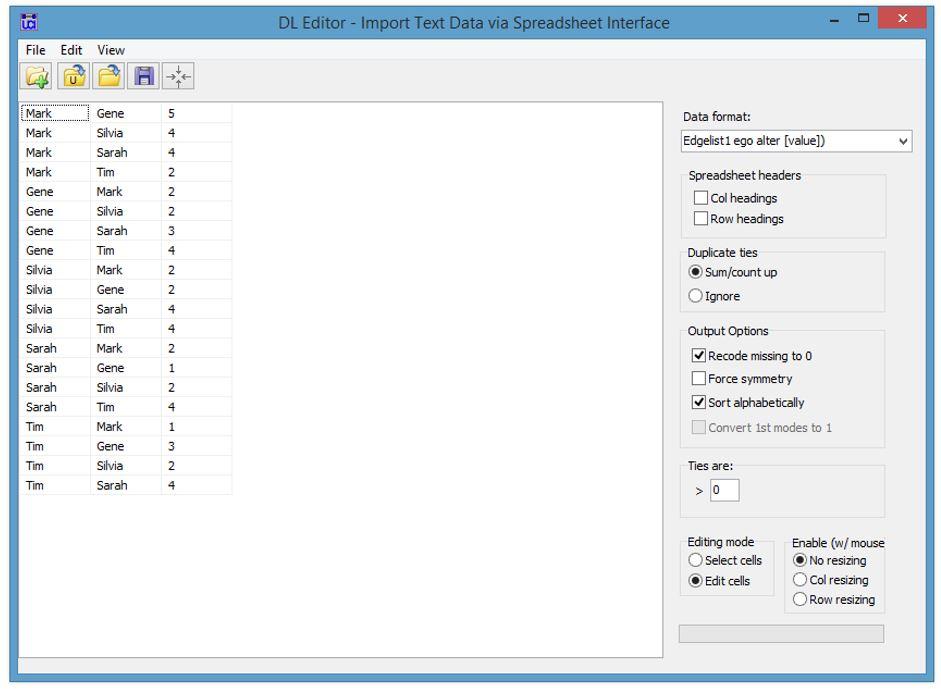
The Excel file opened in the DL Editor. Now simply save the file as a UCINET file
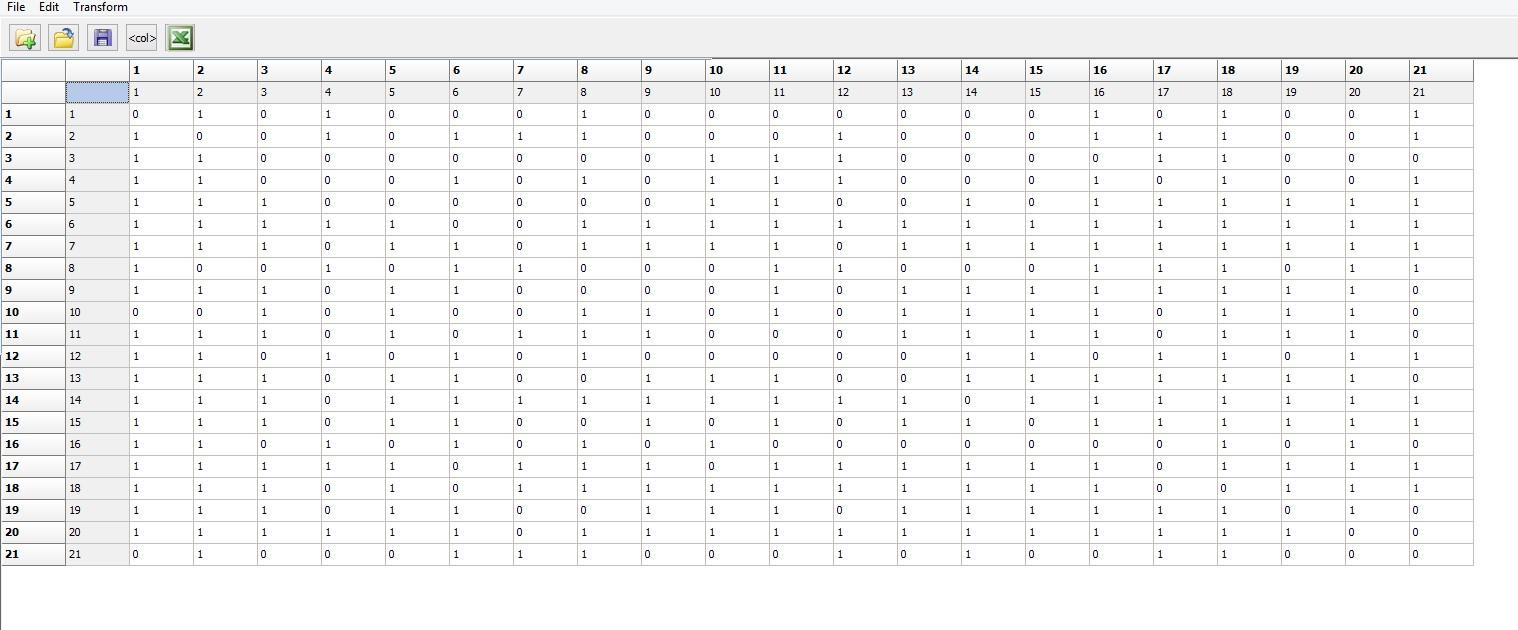
5. Often the direction of ties need to be reversed for conceptual or other reasons. Advice relations are one clear example. In asking who one goes to who for advice the direction of the tie is from ego to an alter. But we might care about the flow of advice in a network and would therefor want to reverse the direction of the tie. For Krackhardt’s advice network (KRACKAD.##h) transpose the matrix. In UCINET go to Transform|Transpose and input the data file and click on OK.
EXERCISES NOTE: The KRACKAD network used for problems in Chapter’s 5 and 10 are not the same in the KRACKAD in the UCINET standard datasets.
Original:
Transposed:
Answer: Now instead of who one seeks advice from, the row entry now means who one gives advice to.
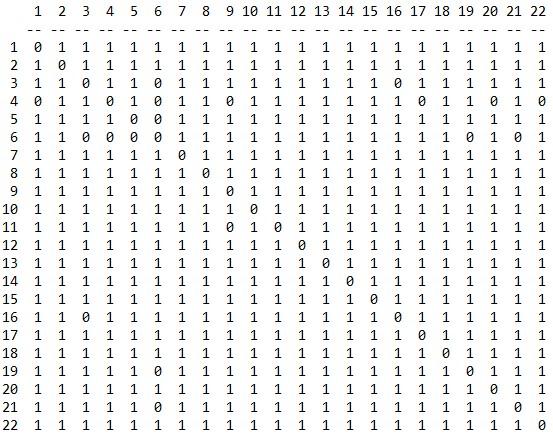
6. Many types of network measures and procedures require that the data be symmetrical. For the Krackhadt advice network in problem 5 above, symmetrize the adjacency network using both the minimum and maximum method. Go to Trannsform|Symmetrize and upload “KRACKAD.##h”. Run once using the “Maximum” and once the “Minimum” symmetrizing method.
Symmetrized using the Maximum:
Symmetrized using the Minimum:
What is the difference between the two methods in terms of the observed ties in each of the symmetrized matrices?
Answer: When using the minimum depending on the type of relation there will more 0 cells than when using the maximum. The network will tend to be sparser.
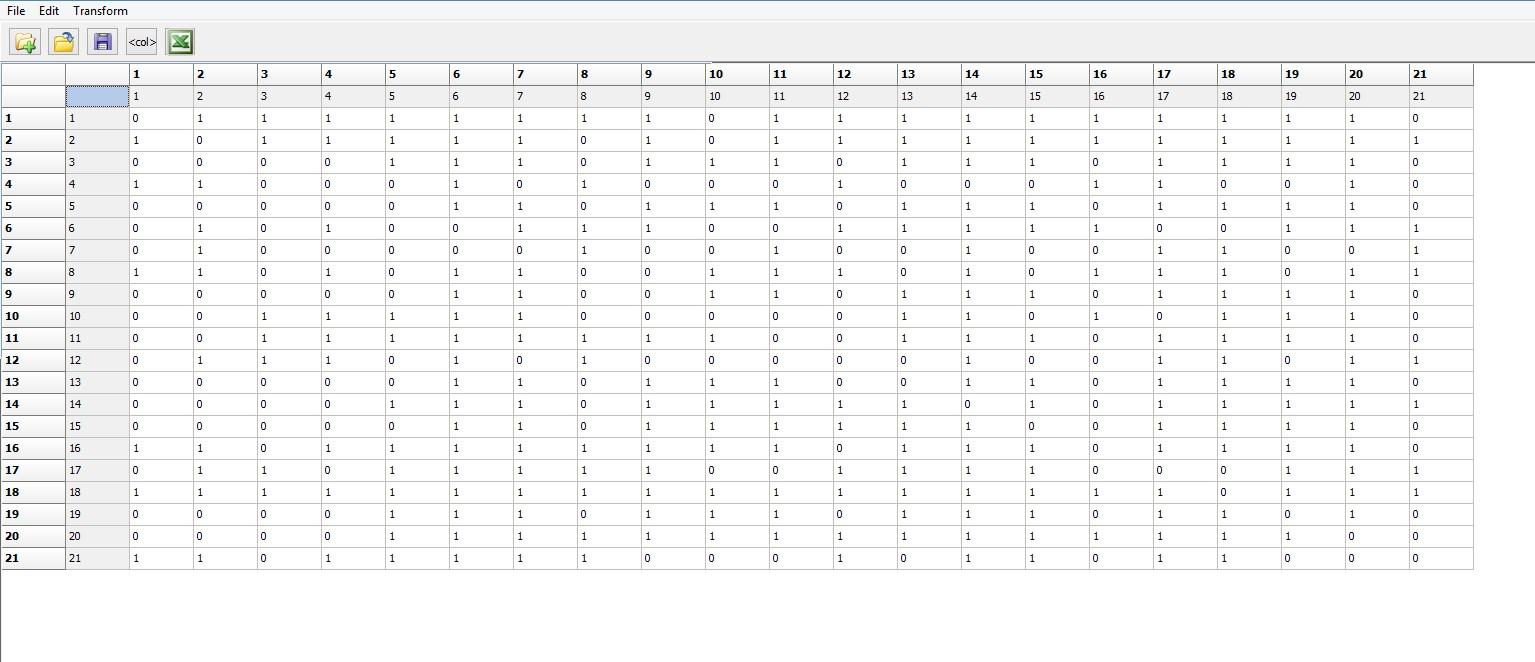
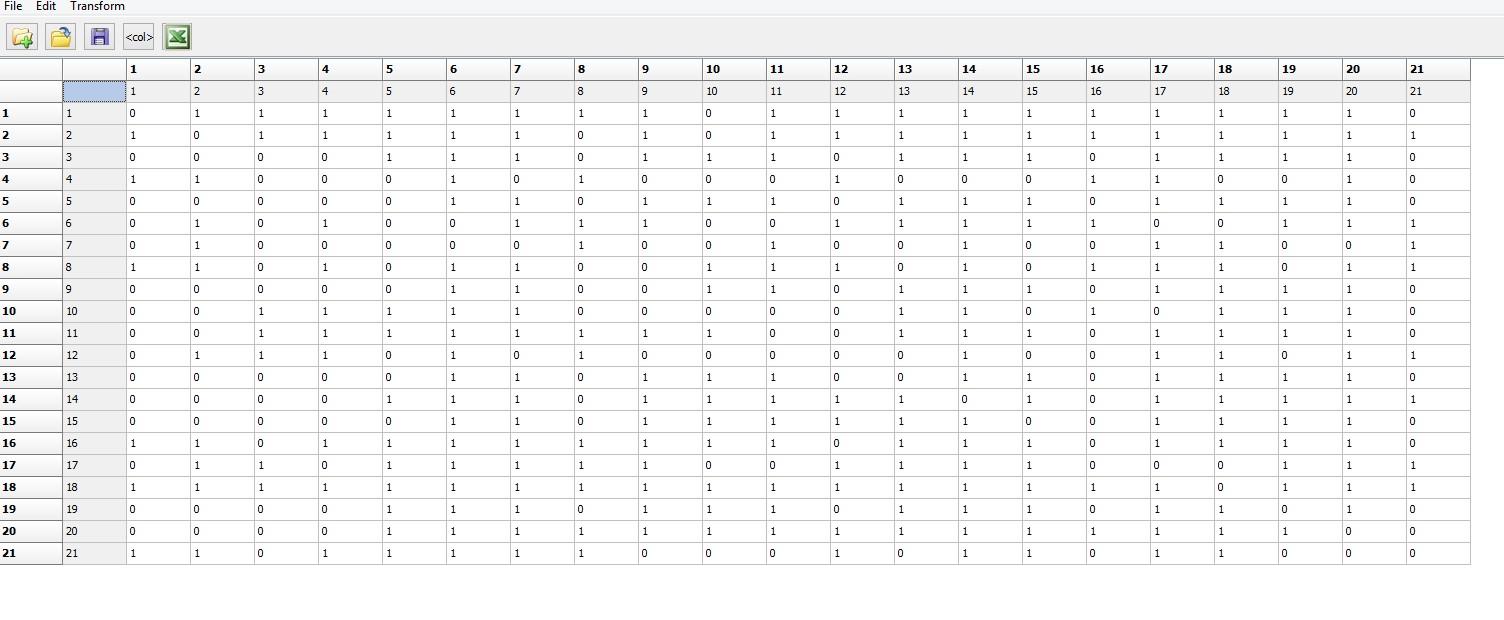
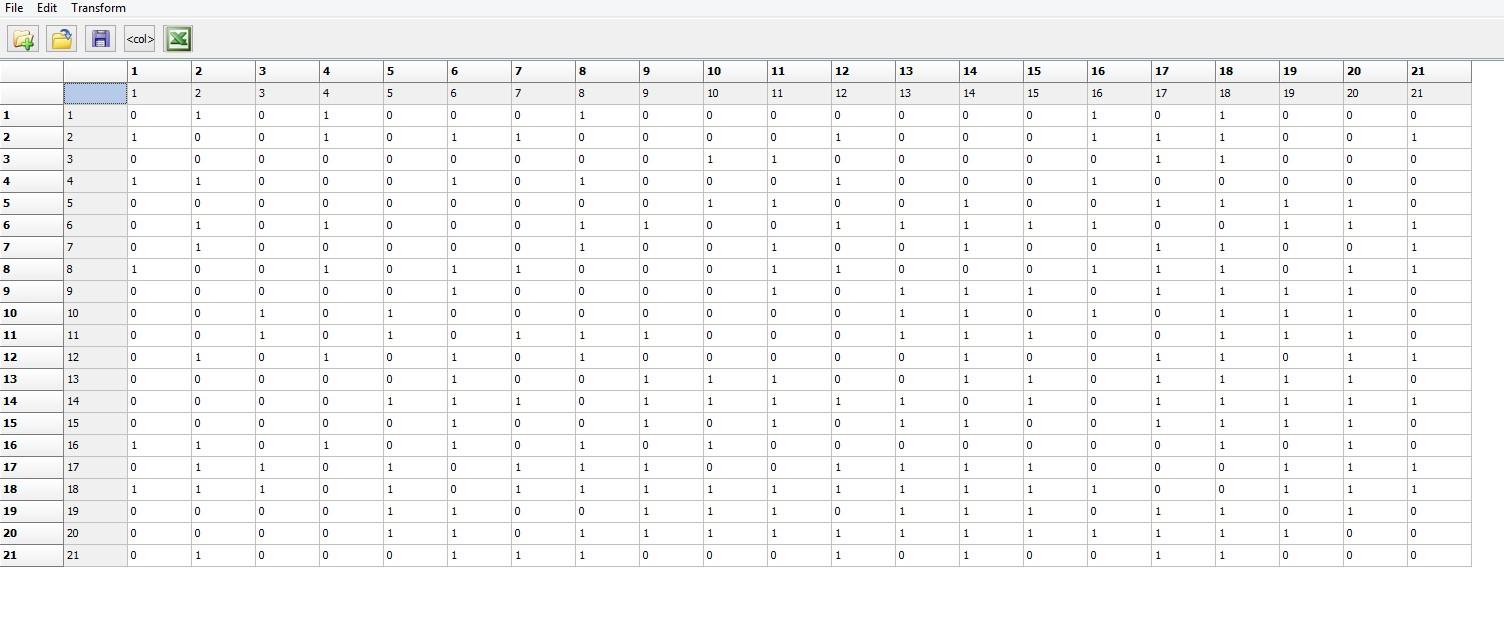
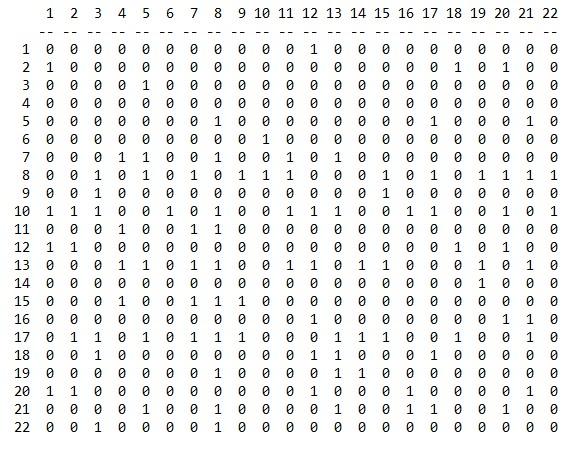
7. Similar to problem 6 above, many types of network measures and analyses require the data to be in the form of adjacency matrices involving 1s and 0s. The file “Beginning_Winter_Valued.##h” is a proximity matrix containing South Pole crew member’s reports of social interaction on a scale from 0 to 10 at the beginning of the winter, with zero being not at all and 10 very frequently. The data need to be dichotomized. Dichotomize the matrix at three different levels of tie strength. Go to Transform|Dichotomize and input the proximity matrix. Under the dichotomization rule produce one dichotomized adjacency matrix at a weak tie strength, one at a moderate tie strength and one at a strong tie strength. In a comparison of the three adjacency matrices, how do the number of observed ties differ among the three networks?
Values Greater Than 0
Values Greater Than 4

Values Greater Than 6
Answer: For values greater than 0 this reflect any value of 1 and above. As you can see this does not help in understanding the structure of the group since almost everyone has a tie of strength one or more to all others. The next analysis moves to ties of moderate strength of values greater than 4. With the threshold increased to relationships greater than 4 there are more zero cells. We might think of these as moderate to strong relationships. With values greater than 6, these represent strong relationships and as we can see, there are many more zero cells.