Analyzing Social Networks
Chapter 15: Ego Networks
15.7 Problems and Exercises
› Click here to download corresponding data
2. A researcher decides to limit the number of alters’ ego names to six (alter1, alter2, alter3, and so on). Construct an alter name inter-relator matrix that could be used in a survey to collect alter–alter tie data.
See Figure 15.2 for an example.

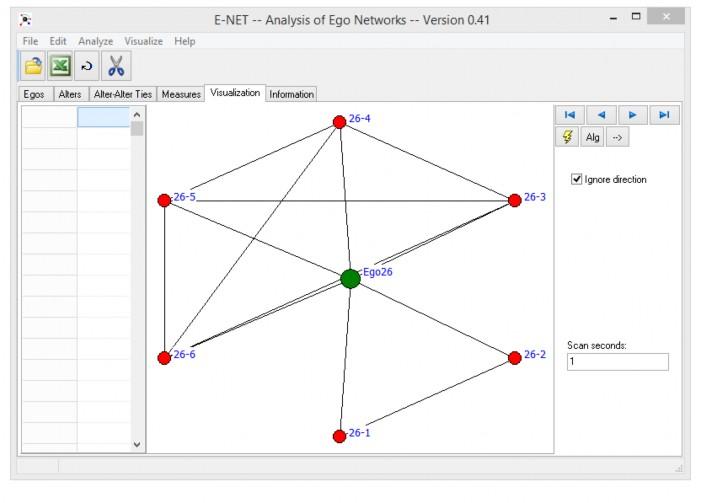
4. Using the E-NET row-wise example file from the chapter “enet_example.txt” open E-NET and click on File|Import and click on Row-Wise selection and click OK. Load the ENET example file and click OK. This is just a simple dataset containing three egos (the attributes for egos should be displayed). Before we can visualize the ego networks we must make certain to filter the Alter-Alter Ties to include only alters that ‘know’ of each other. Go to Alter-Alter Ties and in the box to the upper right (Alter-Alter ties filter criteria) type into the box “knows>0”. This will filter out alter–alter ties in which alters do not know one another. Click on Filter and create the working dataset. To visualize each of the ego networks click on Visualization and the network for one of the egos should be displayed. To move through the visualizations of the ego networks go over to the left or right arrows (upper right) and click to display the next ego network. Go through all three ego networks. How would you describe the differences (or similarities) in network structure across the three networks? We can also compare the structural and compositional characteristics of the ego networks using structural holes and cohesion measures. Go to Analyze|Structural holes and leave the default “None” for each of the tie strength variables and click OK. Which of the three egos has the most social capital according to structural holes theory?
Input of row-wise file

Alter-Alter ties filter

Visualization of ego network for Ego26

Structural Holes Results
5. For this problem we will use the GSS dataset used in the column-wise example in the chapter (GSS 1985 network data.xlsx). To load the data into ENET go to File|Import and click on Column-Wise and click OK. Load in the GSS dataset and click on Load. To load the variables for ego, ego–alter and alter–alter go to the Auto button on the bottom left and click (this will automatically load the variables). Once the variables are loaded click OK. Now the data are ready for analysis. One interesting question to examine is do the ego networks show more homophily on the basis of sex or race? To exam this go to Analyze|Homophily. In the middle box highlight SEX=SEX and click on the right arrow to the right and move it to the box to the right. Do the same for the RACE=RACE variable. Once loaded click OK. A text output file will open showing the E-I index for sex and race for the entire sample. Also a set of measures were calculated for each ego including the E-I index and the proportion of alters in the ego network of the same sex and race. Does homophily by sex and race in ego networks differ? Also, what is the relationship between the “same proportion” variable and the E-I index for sex and race?
Answer 1:There is much stronger homophily by race than by sex suggesting that egos interact more with members of their own race than across races. This is less so for sex. It is readily apparent from the comparison of the E-I index with the measure “same proportion” that they are related. A same proportion value of 50.0 corresponds to an E-I index value of 0.0 (50 percent same race), while a same proportion value of 100 corresponds to an E-I index of -1.0 (100 percent same race).
Results for E-I Index analysis

Comparison of E-I index and “Same Proportion” for each ego.

Answer 2: There is more homophily by race than by sex