Chapter 10: Testing for Specific Differences: Planned and Unplanned Tests
10.1 For a contrast to be linear its weighting coefficients must sum to 1.0. If there are three conditions and if two of the conditions are weighted −0.5, then the third condition – in this case condition 2 – must be weighted +1.0.
10.2 Perhaps you suspect that there is little if any effect of having only a single cage-mate for the hamster. Furthermore, you are not interested in small effects. You hypothesize that there is a substantial effect when there are four or more animals per condition. Thus, you consider combining condition 1 and condition 2 to be appropriate. You consider the average of their two means to be the most appropriate control for testing condition 4. Furthermore, combining the two conditions does nothing to change the error term, which remains the MSerror from the initial omnibus ANOVA.
10.3 If the first contrast were: (−3) + (−1) + (+1) + (+3) = 0
a second set that would be orthogonal to these would be: (+1) + (−1) + (−1) + (+1) = 0
The product of the respective coefficients is: (−3) + (+1) + (−1) + (+3) = 0
Because the sum of the products is 0.0, these two contrasts are deemed orthogonal.
Next, you need a third contrast that is orthogonal to both: (−1) + (+3) + (−3) + (+1) = 0
The product of these coefficients with those of the
the first contrast is: (+3) + (−3) + (−3) + (+3) = 0
Because the sum of the products is 0.0, these contrasts are deemed orthogonal.
The product of these coefficients with those of the
the first contrast is: (−1) + (−3) + (+3) + (+1) = 0
Because the sum of the products is 0.0, these contrasts are deemed orthogonal.
10.4 The sum of the SScontrast for the two repeated-measures (45.0) contrasts is greater than the SStreatment for the omnibus repeated-measures ANOVA (43.40). The reason for the difference rests in the fact that the two contrasts are not orthogonal to each other. The weighting coefficients for the three conditions for the first contrast can be described as 0, −1, and +1, respectively. The weighting coefficients for the three conditions for the second contrast can be described as −1, +1, and 0. The sum of the products of the coefficients is −1. Non-orthogonality means that the contrasts in part overlap. It is this overlapping of the two contrasts which causes some of the SStreatment to be counted twice. Thus, the sum the SScontrast for the two repeated-measures (45.0) contrasts is greater than the SStreatment for the omnibus test.
10.5 A correlation (r) between any two sets of numbers indicates the degree of relationship between them from 0.0 to 1.0 (either negative or positive): that is, how well you can predict a number in one set from knowing a number in the other set. A zero means no relation and a 1.0, regardless of the sign, means a perfect relation. Another way to say that two sets of numbers are uncorrelated (r = 0.0) is to state that they are orthogonal to each other. As we have seen, two contrasts are orthogonal if the sum of the products of their weighting coefficients is 0.0.
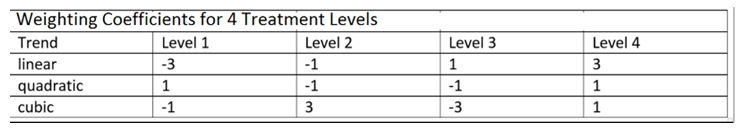
If you sum the products of the weighting coefficients of the linear and the quadratic trends you will find it to be 0.0: (−3)(+1) + (−1)(−1) + (+1)(−1) + (+3)(+1). If you sum the products of the weighting coefficients of the linear and the cubic trends you will find it to be 0.0: (−3)(−1) + (−1)(+3) + (+1)(−3) + (+3)(+1). And, finally, If you sum the products of the weighting coefficients of the quadratic and the cubic trends you will find it to be 0.0: (+1)(−1) + (−1)(+3) + (−1)(−3) + (+1)(+1). To say that all pairs of the contrasts are orthogonal is to say that the correlation of all the correlations among the three polynomial trends is 0.0.
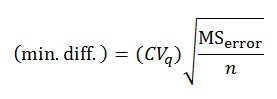
10.6 When there are only 2 dftreatment there can only be a pair of orthogonal contrasts. Assume that the first is a linear contrast. When the SSlinear are subtracted from the SStreatment overall the residual sum of squares – called here the deviation – is the SSquadratic. With one 2 dftreatment there is 1 dflinear and 1 df(deviation/quadratic). Thus, the MSdeviation and the MSquadratic must be the same. As a consequence, the F-values of the Deviation and the Quadratic Trend also must be identical. If there had be four treatment conditions, that is, 3 dftreatment, this would not necessary be the case.
10.7 You might begin by naming and ordering the conditions. Condition 1 has a mean of 2; condition 2 has a mean of 4; condition 3 has a mean of 5; condition 4 has a mean of 8. The MSerror from the omnibus ANOVA is 2.50. There were 4 dferror (i.e., 5 − 1) in each condition. Thus, there were 16 dferror overall. The NK test is based on calculating a min. diff. (minimum difference) required for two means to be significantly different. The min. diff. is adjusted for the position of the two means in the rank order. The critical values of q (CVq) is obtained from Appendix H Studentized range statistic.
For a family of 4 (this will allow you to test the difference between condition 1 and condition 4) the min. diff. is
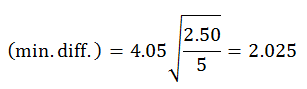
Because the observed difference between the two conditions (8 − 2 = 6) is greater than the min. diff., you conclude that there is evidence that the means are different.
For a family of 3 (this will allow you to test the difference between condition 1 and condition 3 as well as between condition 2 and condition 4) the min. diff. is
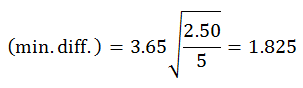
Because the observed differences between both pairs of means are greater than the min. diff., you conclude that there is evidence that the mean of condition 1 is different from the mean of condition 3, and that the mean of condition 2 is different from the mean of condition 4.
For a family of 2 (this will allow you to test the difference between condition 1 and condition 2, between condition 2 and condition 3, and between condition 3 and condition 4) the min-diff is
(min. diff.) = 3.00
There is evidence that condition 1 is different from condition 2, and condition 3 is different from condition 4, but there is insufficient evidence to conclude that conditions 2 and 3 are different.
Given the pattern of significant differences among the means, it appears that there are three clusters of groupings of the conditions. Condition 1, which is different from all other conditions, is a group on its own. Conditions 2 and 3 are a second grouping. Finally, condition 4, which is different from all other conditions, is also a group on its own.
10.8 Nonparametric tests are often used to test measurement data when the researcher is concerned that one or more of the assumptions required for ANOVA, such as normality, are violated. When the number of observations is small, such as in the current case, it is extremely difficult to test assumptions such as normality and homogeneity of variance. Hence, some researchers will argue that nonparametric tests should always be used when the sample size is small, even when the data are measurement in nature.