Statistics with R
Student Resources
Chapter 2: Descriptive Statistics: Tabular and Graphical Methods
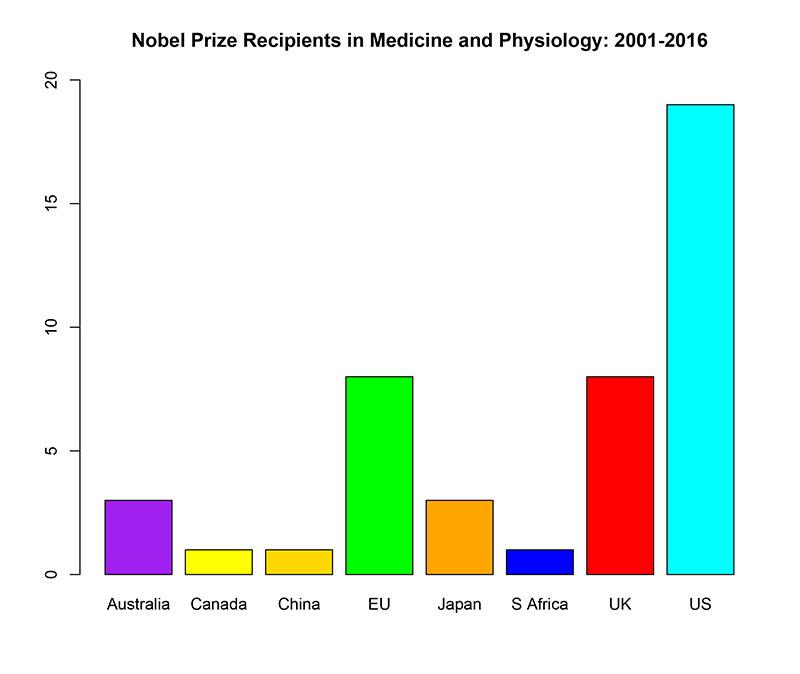
1. The image below shows the bar graph of data values in the object named “nobelprizes.” Which function produces the image?
- barplot(nobelprizes, ylim = c(0, 20), main = 'Nobel Prize Recipients in Medicine and Physiology: 2001-2016')
- barplot(nobelprizes, xlab = ‘Nations/Regions’, ylab = ‘Counts’)
- barplot(nobelprizes, xlim=c(0,20), col = c(“palette”)
- barplot(nobelprizes, ylim = c(0, 20), col = c('purple', 'yellow', 'gold', 'green', 'orange', 'blue', 'red', 'cyan'), main = 'Nobel Prize Recipients in Medicine and Physiology: 2001-2016') X
Solution:
The correct choice is d.
2. The first step to producing the above image involves creating an object that contains the relevant data values---in this case, the country/region of those scientists who have been recipients or co-recipients of the Nobel Prize in medicine/physiology during 2001-2016. Which of the choices below can be used to create such an object? (Note that the object name is “medicine.”)
- medicine <- c(seq(Australia, 3), seq(Canada, 1), seq(China, 1), seq(EU, 8), seq(Japan, 3), seq(S Africa, 1), seq(UK, 8), seq(US, 19))
- medicine <- c(rep('Australia', 3), rep('Canada', 1), rep('China', 1), rep('EU', 8), rep('Japan', 3), rep('S Africa', 1), rep('UK', 8), rep('US', 19)) X
- medicine <- c(seq(‘Australia’, 3), seq(‘Canada’, 1), seq(‘China’, 1), seq(‘EU’, 8), seq(‘Japan’, 3), seq(‘S Africa’, 1), seq(‘UK’, 8), seq(‘US’, 19))
- medicine <- c(rep(Australia, 3), rep(Canada, 1), rep(China, 1), rep(EU, 8), rep(Japan, 3), rep(S Africa, 1), rep(UK, 8), rep(US, 19))
Solution:
The correct choice is b.
3. The second step to producing the above image involves creating the final object that is submitted to the barplot() function. (In this case, that object has been named “nobelprizes.” See the exercise 1.) Which of the choices below can be used to create such an object?
- nobelprizes <- hist(medicine)
- nobelprizes <- summary(medicine)
- nobelprizes <- table(medicine) X
- nobelprizes <- barplot(medicine)
Solution:
The correct choice is c.
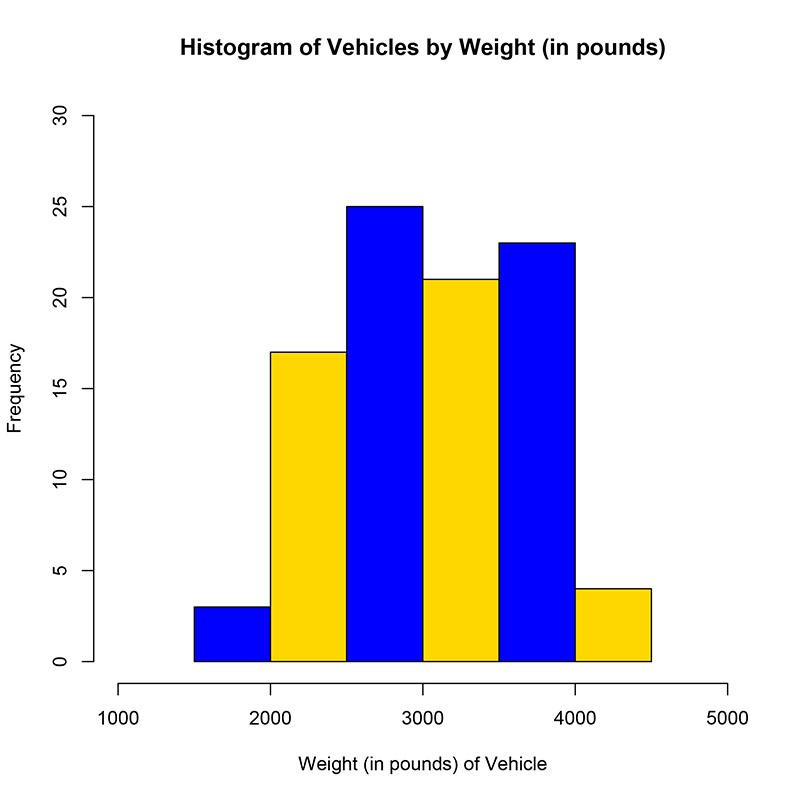
4. This image shows the distribution of “Weight” from the “Cars93” data (see Chapter 2, exercise 4). Which choice can be used to create this image?
- hist(Cars93$Weight, col = c('blue', 'gold', 'blue', 'gold', 'blue', 'gold'), xlab = "Weight (in pounds) of Vehicle", ylab = "Frequency", xlim = c(1000, 5000), ylim = c(0, 30), main = "Histogram of Vehicles by Weight (in pounds)") X
- hist(Cars93$Weight, breaks = 20, col = c(“palette”) )
- hist(Cars93$Weight, breaks = 6)
- hist(Cars93$Weight, breaks = c(“best subset), col = c(“blue, “gold”))
Solution:
The correct choice is a.
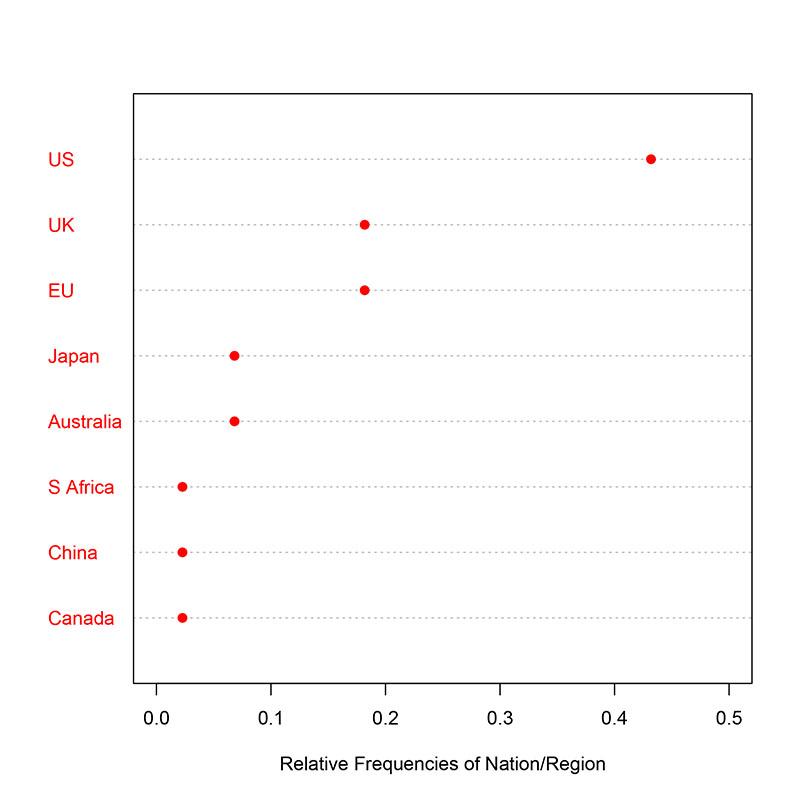
5. The image below shows plot of data values in the object named “nobelprizes” (see the first exercise above). Which function produces the image?
- dotchart(sort(nobelprizes / sum(nobelprizes)), xlab = "Relative Frequencies of Nation/Region", xlim = c(0, 0.50), pch = 19, col = "red") X
- dotchart(nobelprizes / sum(nobelprizes), xlab = "Relative Frequencies of Nation/Region", xlim = c(0, 0.50), pch = 19, col = "red")
- plot(nobelprizes, xlim = c(0, 0.50), pch = 19, col = "red")
- plot(sort(nobelprizes / sum(nobelprizes)), xlab = "Relative Frequencies of Nation/Region", xlim = c(0, 0.50), pch = 19, col = "red")
Solution:
The correct choice is a.
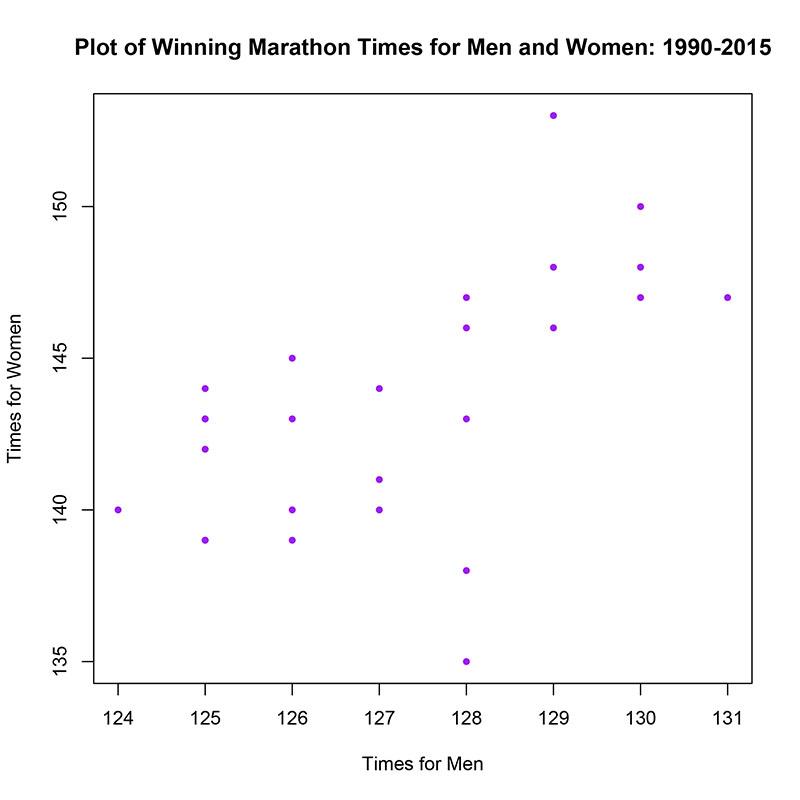
6. The image below shows the scatterplot of data values in the object named “london.” Which function produces the image?
- plot(Men, Women, xlim = "Times for Men", ylim = "Times for Women")
- plot(london$Women, london$Men, col = “purple”, pch = 17)
- plot(london$Men, london$Women, 20, “purple”)
- plot(london$Men, london$Women, pch = 20, col = "purple", main = "Plot of Winning Marathon Times for Men and Women: 1990-2015", xlab = "Times for Men", ylab = "Times for Women") X
Solution:
The correct choice d.
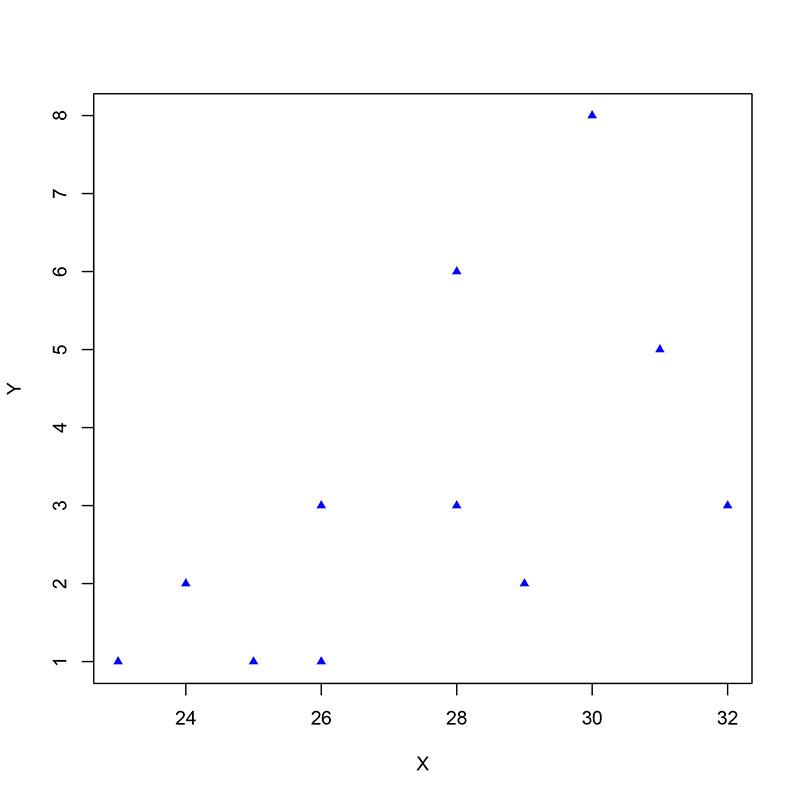
7. The image below shows the scatterplot of data values in the object named “hetero.” Which function produces the image?
- plot(hetero$X, hetero$Y, col = "blue", pch = 17, xlab = "X", ylab = "Y") X
- plot(hetero$X, hetero$Y, pch = "blue", col = 17, xlab = "X", ylab = "Y")
- plot(hetero$Y, hetero$X, col = "blue", pch = 17, xlab = "Y", ylab = "X")
- plot(hetero$X, hetero$Y, col = "blue", pch = 17, main = “A Scatterplot”)
Solution:
The correct choice is a.
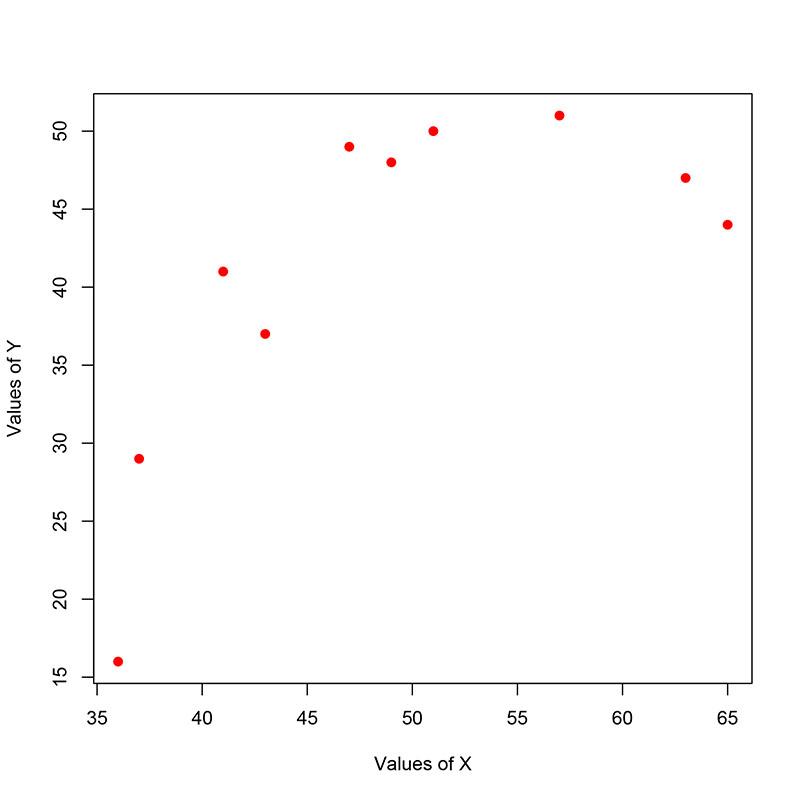
8. The image below shows the scatterplot of data values in the object named “parabola.” Which function produces the image?
- plot(parabola$Y, parabola$X, xlab = "X", ylab = "Y", pch = 19)
- plot(parabola$X, parabola$Y, xlab = "Values of X", ylab = "Values of Y", pch = 19, col = "red") X
- plot(parabola$X, parabola$Y, main = “A Scatterplot, pch = 19)
- plot(parabola$X, parabola$Y, pch = “red”)
Solution:
The correct choice is b.
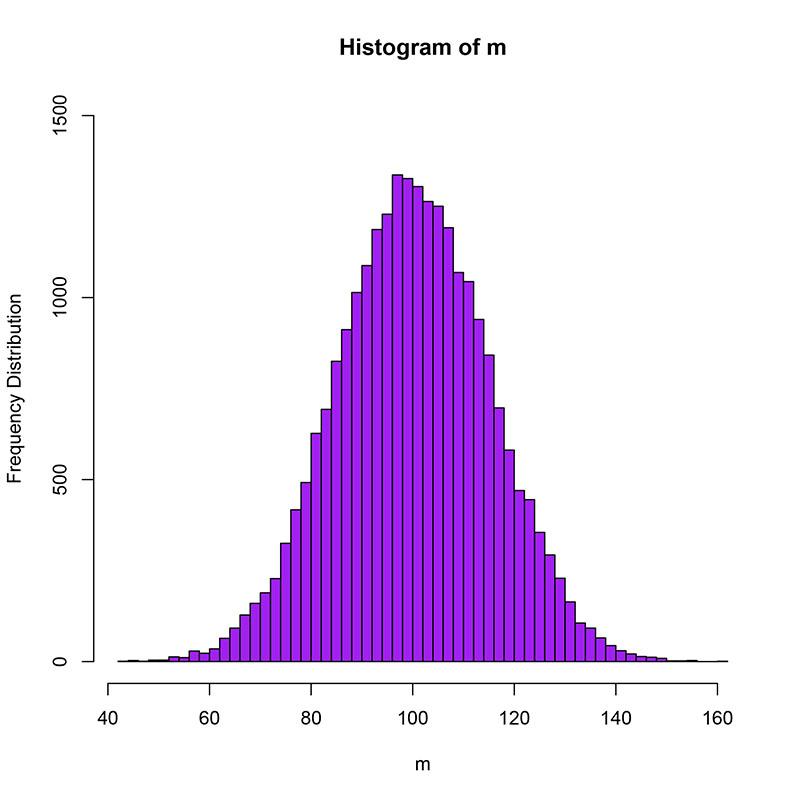
9. The image below shows the distribution of data values in the object named “m.” Which function produces the image?
- hist(m, col = "purple", xlab = “m” )
- hist(m, breaks = 50, col = "purple", xlim = c(40, 160 ))
- hist(m, breaks = 50, col = "purple" )
- hist(m, breaks = 50, ylab = "Frequency Distribution", col = "purple", ylim = c(0, 1500)) X
Solution:
The correct choice is d.
10. The image below shows the distribution of data values in the object named “n.” Which function produces the image?
- hist(n, breaks = 50, col = "green", main = "A Histogram")
- hist(n, breaks = 50, col = "green", xlim = c(0, 100), ylim = c(0, 1200))
- hist(n, xlim = c(0, 100), ylim = c(0, 1200), main = "A Histogram")
- hist(n, breaks = 50, col = "green", xlim = c(0, 100), ylim = c(0, 1200), main = "A Histogram") X
Solution:
The correct answer is d.
