Using Software in Qualitative Research
A Step-by-Step Guide
Student Resources
Chapter 11 – Mapping (MAXQDA)
Download the pdf for this chapter guide here.
Chapter 11 discusses some of the varying principles, functions and rationales behind mapping tools where they are available in software. Mapping in a graphic sense may relate to theoretical models or simply be a way of stepping back from the data to express, visualize and communicate connections that are beginning to be observed. See all coloured illustrations (from the book) of software tasks and functions, numbered in chapter order.
Sections included in the chapter:
Traditions of mapping
Specific functions and specialities
Mapping to express theory
Expressing links between text passages
Visualizing co-occurring codes
Linking concepts
Layers, creating, hiding and revealing them
MAXQDA11 and Case Study B – Using MAXMaps – the basic tools
The mapping tool in MAXQDA11 is called “MAXMaps” and it can be launched from the “Visual tools” menu or, if it is open, with the first icon on the Visual tools toolbar. It opens in a new window on top of the main screen; there will be times when you want to have access to both the project screen and the map window so that you can drag items from the project onto a map.
Figure 11.1.1 shows an illustration of the mapping window with a partly completed map in place. The first time you open MAXMaps in a new project it will only have empty panels but you will soon learn how to create maps of different kinds for a variety of purposes.
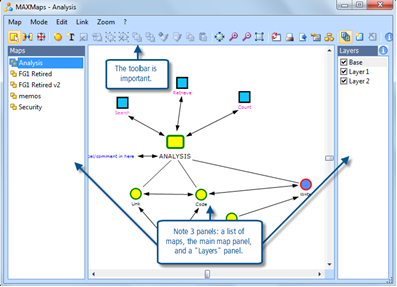
Figure 11.1.1 – MAXMaps – an abstract map
Figure 11.1.1, above, illustrates a map of abstract ideas. In this view there are three panels showing in the MAXMaps window: to the left a list of the maps already created in this project, in the centre the map itself, and to the right a list of layers with check boxes indicating which ones are currently displayed. Our first exercise will lead you through the procedures to create something like this for yourself.
Working Modes
Before we look at the processes used to create a map it is necessary to understand the various modes in which you work in this part of the program. There are three mutually exclusive working modes called “Select”, “Link” and “Move”. You can only be in one of these modes at any moment, so changing to another mode closes the previous one. The modes limit the activities that you can do at any one time and so you need to become familiar with what you can do in each.
The “Select” mode is probably the one you will use most of the time. In this mode you can create objects and drag them around inside the map to place them where you want. The objects can represent abstract ideas (as in Figure 11.1.1) or they can be items from your project such as documents, codes, memos or data segments. You can even include images in your maps.
The “Link” mode is where you create lines or arrows to indicate connections between the objects in the map. Again the linking arrows can represent simple or complex ideas, tentative suggestions or important conclusions. You can choose to represent different strengths of connection with varying thicknesses of the lines, or even with varying colours.
The “Move” mode allows you to move the working window over different parts of the map. This becomes useful when you have created a large map and you need to be able to concentrate your attention on one part of it at a time. In this mode you can zoom in or out, to see the map apparently enlarged or shrunk, and you can drag the whole map across the working screen.
A few moments’ thought will help you to understand why the 3 modes are required, it is all to do with using the mouse movements to create different effects. In Select mode by clicking on and dragging an object you can move it around within the map. In Link mode you use similar techniques to make the links, and you don’t want the objects to move as you link them together. In Move mode you again use clicking and dragging, but this time you want the whole map to move as a single object so that you can get to a corner of the map that might otherwise be off the screen.
There is a fourth mode, but one that has a completely different dimension, this is called “Synchronisation” or “Sync mode” for short. This mode is about connecting the map to the data in your project and it can be switched on or off independently of which of the other 3 modes is currently in force. When you create a map of abstract ideas, such as the one illustrated in Figure 11.1.1, you can work with sync mode turned off. But when you want to drag in elements of your data to think about the relationships and connections between them then you need to turn sync mode on.
It is important to note that the synchronisation between the project and a map only works in one direction, from the project to the map. The consequence of this is that any links that you make or break within the map are not repeated in the project. This means that the maps are an exploratory tool where you can play with ideas and possible connections as many times as you like without making any changes to your underlying data or analysis. It does also mean that if your map helps you to identify a significant connection or relationship within your data you will need to find a way to record that discovery within the project itself, such as with memos, hyperlinks or more coding.
You can switch between the 3 working modes, and turn sync mode on or off, with toolbar buttons or menu selections. The “Mode” menu in the MAXMaps window has 3 options, one for each mode, and a reminder of the toolbar icon for each. An illustration of the left-hand part of the toolbar is shown in Figure 11.1.2 with the 3 mode buttons.
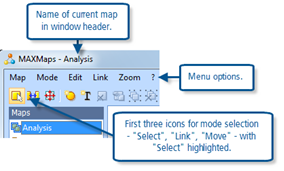
Figure 11.1.2 – MAXMaps menu and mode toolbar icons.
Note how, even before you have begun to create a map, as you select each of the 3 mode buttons the rest of the MAXMaps toolbar changes. This shows how different toolbar functions become available in the 3 working modes.
Creating a simple map of abstract objects
To start a new map, go to the “Map” menu and select the option at the top of the list – “New”. This will create a new blank map in the main panel of the MAXMaps window.
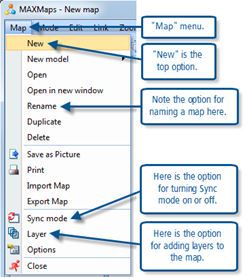
Figure 11.1.3 – MAXMaps “Map” menu options.
A new map is given the default name “New map” – this can be changed at any stage by using the option “Map > Rename” which can also be seen in Figure 11.1.3.
Make sure that the working mode is set to “Select” by clicking on the first button in the MAXMaps window toolbar (or the menu option “Mode > Select”).
Add objects to your map by clicking on the 4th and 5th buttons on the toolbar (“New free object” and “New text field”) as can be seen in Figure 11.1.4 below. These buttons are only visible when the mode is set to Select.

Figure 11.1.4 – Adding a new free object to a new map
The way you work is that you add the basic shape first and then you modify it with the colours and effects that you want to use in the final map. All new objects appear in the top left corner of the map panel when they are first created and you then drag each one to the location on the map where you want it to be shown. Here we have chosen to add a rectangle with rounded borders to the new map.
To modify an object in a map use a right-click on that object to open a context menu, and select the last option in that context menu – “Properties”. (Note that you get a different context menu if you right-click on the box at the bottom right corner of the object, this offers you “Layers” only which we don’t want at this time). Figure 11.1.5 shows the “Properties” dialog, partially edited.
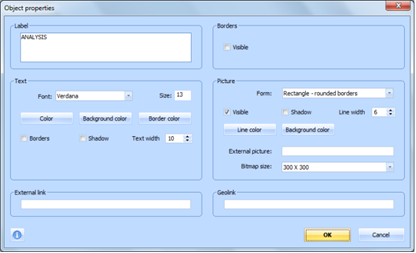
Figure 11.1.5 – MAXMaps object properties dialog
Note how much of the left half of this dialog controls the label that appears beneath the object, while much of the right half controls the object itself. It would be tedious to go through each of the fields in this dialog in detail, the best way of learning how they work is to try each of them in turn and observe the effects so created. You will need to type a label into the top left field in order to observe how the choices below that work out – here we have added “ANALYSIS” as the label. You will achieve more colourful maps if you use different colours for the background and border on the label side and for the line and background on the shape side. The option to have visible borders in the upper right of the dialog provides the possibility of a feint outline enclosing the shape and its label.
You can change the size of an object in the map by clicking on and dragging its bottom-right corner. When you do this the whole object, including its label, will change size, so you may want to further edit the font size of the label in the properties dialog to restore that to its previous size.
When you have gone to a lot of trouble to get one object looking just the way you want it, you may want to duplicate it with another identical or similar object to carry another meaning in your map. While in the Select mode you have a pair of icons on the toolbar for copy and paste operations. The paste button will add whatever object you last copied in the top left corner of the working panel, so you then need to drag it to its required location.
TIP: It may sometimes be easier to copy and paste an existing object before editing it to change its colours, to obtain a similar but different object – instead of creating it from scratch.
If you want an object with text inside the shape you should use the 5th icon on the toolbar (“New text field”). Here you only need to edit the properties on the left side of that dialog, but with a little experimentation you should soon be able to generate colourful text boxes as well.
Using the above guidance, create a map with about 5 objects. Then click on the 2nd button to change to “Link” mode. Note how the toolbar buttons change so that you can no longer see the new object buttons, but instead you can now see some arrow buttons. Now experiment with connecting some of the objects in your map with the different linking types (line, one direction, and double arrow). It is quite intuitive, you select a link type by clicking on toolbar button and then apply it by dragging the mouse pointer from one object to another.
If you don’t like a particular link effect you can use the option “Edit > Undo changes” to remove the last link you created.
Now switch back into Select mode. Experiment with dragging an object with one or more links to a different location on the map. You should see that the links move with the objects so that, once connected, they remain connected wherever they are located on the map.
In Select mode it is possible to edit the properties of each link, to change its colour, the thickness of its line, and to add a label if required. You simply right-click on any part of the link and then click again on the properties option which then appears. The dialog which follows is different from the object properties dialog, see Figure 11.1.6 below.
Once again, experiment with different styles of connecting links and label some of them.
Finally it is time to experiment with the “Move” mode. Click on the 3rd icon in the toolbar (or use the menu option “Mode > Move”). Again the toolbar changes, now showing fewer available buttons than in either of the other 2 modes. Now you should be able to drag the whole map around in the working panel as a single item. You can also enlarge or shrink the map by using the “+” and “-“ icons in the toolbar and the other two buttons on either side of them which return the map to its original size or fit it within the current window. All of these tools become useful with a large and complicated map because they allow you to work accurately in any part of the map without having to display the entire map in a limited area of screen.
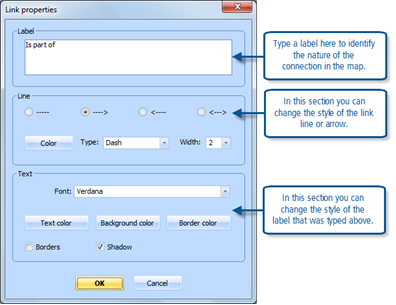
Figure 11.1.6 – MAXMaps Link properties dialog
The changes that you have made to your map are saved in MAXQDA11 when you close this window. However it would be a good idea to practice naming your map so that you can identify it in the list as you develop more maps. Use a right-click on the “New map” label in the panel with the list of maps to the left of the MAXMaps window and select the “Rename” option in the context menu that opens there. Maybe call the map something like “Trial 1”. Then practise closing the MAXMaps window before re-opening it and finding your map again.
Using “Layers”
A final exercise with this first map of abstract objects is to explore how identifying different objects with different layers allows you to create a map in which you can hide certain elements and then add them to the display with a single click. This might be used in a presentation or discussion about the project, or it might be used as a way of clarifying your own ideas by examining different sections of the model without the distraction of other parts.
To open the layers panel, use the menu option “Map > Layer” or click on the layers icon towards the right-hand end of the toolbar (it is visible in all 3 working modes). In a new map only the “Base” layer is used, but once the layers panel has been opened then further layers can be added with the “New layer” icon. These icons can be seen in Figure 11.1.7 where a total of 4 layers have been created.
The last 3 icons on the MAXMaps toolbar control the layer functions. The “layers” button opens or closes the panel which shows which layers are available and which are hidden. The “New layer” button is used to add further layers when they are required. The “Delete” button will remove an unwanted layer from the list.
Each main object in the map can be assigned to a layer by using the right-click context menu option “Layer“ and then selecting the appropriate layer number from the list in the extended context menu. All objects are initially assigned to the base layer so you only need to reassign those objects that you will want to hide at some stages of the display. You do not need to assign the links to any layers, a link will only be displayed when the objects at both of its ends are displayed.
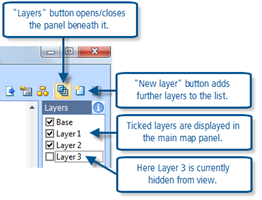
Figure 11.1.7
Experiment with assigning objects in your trial map to one of about 3 layers and then turn those layers on and off in any order or combination (you can display only layer 3, or layers 1 and 3, with and without the base layer).
TIP: If you have used layers in a map at some stage and then closed the layers panel you will not be able to see whether the whole map is being displayed. Always check that you can see the whole map by opening the layers panel from time to time and making sure there is a tick for every layer you have created.
The next exercise will show how to use elements from your project data in a practical map. This exercise was just demonstrating how to use the main tools without thinking about possible meaning or interpretations.
MAXQDA11 and Case Study B – Using MAXMaps with project data
The previous exercise showed you how to manipulate the basic tools in MAXMaps using free-standing objects. In this exercise we will start to explore how you could use the mapping tools to develop your ideas about the project data.
Once again, open MAXMaps with its icon if the Visual Tools toolbar is open (or else with the menu option “Visual tools > MAXMaps”). The last map you worked on will be displayed so, to start a new map, you could use the option “Map > New” to open an entirely blank new map, but this time use the option “Map > New model” and select one of the pre-programmed models from the list that appears in the extended context menu (see Figure 11.2.1 below).
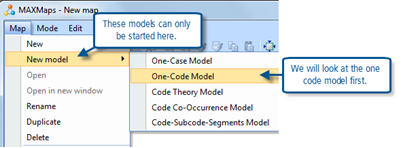
Figure 11.2.1 – MAXMaps, starting a new pre-programmed model
The One Code Model
The start of a one-code model is illustrated in Figure 11.2.2 below. Note how the map window has been placed so that the Code System window can be seen to the left, this will make it easy to follow the instruction that has appeared in the map to drag a code onto the map.
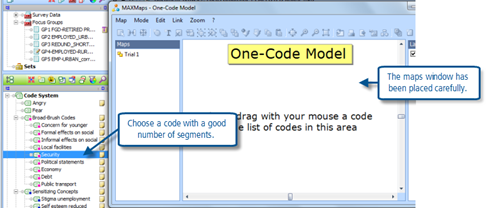
Figure 11.2.2 – Starting a “One-code model”
Now select a code which has a reasonable number of coded segments attached to it, here we will use “Security”, and drag it from the Code System onto the map area. When you drop a code on the new map a dialog opens and you can use this to place some initial restrictions on the amount of material that will be shown on the map. This dialog is shown in Figure 11.2.3 below.
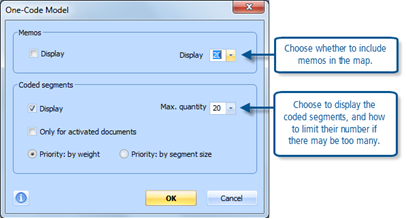
Figure 11.2.3 – Importing code data into a map
The upper section of this dialog is concerned with memos that are linked to this code. These include the single code memo in which you have probably recorded the definition of this code, and any other memos which you have linked from within the memo editing window. These do not include any comments you may have made on specific coded segments.
The lower portion of this dialog is probably more significant as here you can choose how to limit the number of coded segments to be brought into the initial map and provide some rules for applying that limit. If there are more segments available than the limit you set in the “Max. quantity” field to the right, you can choose whether to select segments based on the weighting you have applied to each or, alternatively based on the length of the segments, by using the radio buttons in this section. You can also restrict the document sources of the coded segments by activating those that you want included and ticking the appropriate check box here.
When you click on the “OK” button the material will be added to your map, and laid out in a default shape as shown in Figure 11.2.4 below.
TIP: Once there is some data in the map you can close the “Layers” panel with the menu option “Map > layers” or by using the button near the right-hand end of the toolbar.
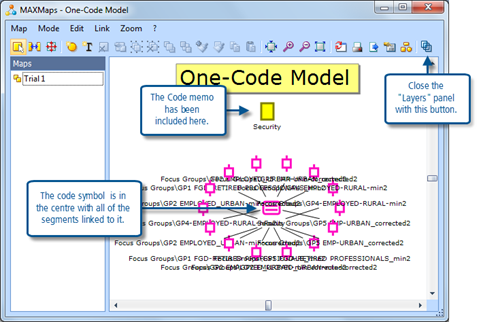
Figure 11.2.4 – The initial import of coded segments
At first glance the map shown here may seem very congested as the labels for all of the objects are overlapping each other. But you can now start to impose your own layout and information on the objects by using the various options available in “Select” mode. For a start you can drag any of the coded segment symbols onto an empty part of the map if you want to read its label clearly. The labels at present show the document group and full document name from where each segment has come, but you can edit these with the “Properties” dialog when you right-click on any segment’s symbol in the map.
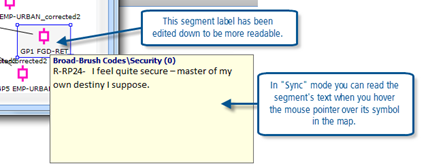
Figure 11.2.5 – Reading segments in a map
Turn on “Sync mode” with the menu option “Map > Sync mode”, or by using the icon just to the left of the printer button on the toolbar. In this mode you can read any coded segment by holding the mouse pointer over its symbol on the map. This is illustrated in Figure 11.2.5 above.
You now have the tools needed to start to re-organise the symbols in the map as a way of taking forward your understanding of the data. Working in “Select” mode, read the text segments and start to drag them around the map to form sub-groups of segments that seem to have ideas in common. With the data in this illustration, some of the speakers were feeling secure themselves while others were expressing the opposite emotion, some were talking about their own security while others were talking about their children’s security. By moving these symbols around and grouping them on the map it becomes even easier to make comparisons and draw distinctions between these segments than it was in the Retrieved Segments window in the main program.
When you have arranged some groups to your satisfaction you can add a free object, such as a text box, as a new label that reminds you of the connection you are making between each sub-group on the map, this is illustrated in Figure 11.2.6 below.
The map you are creating is saved when you close the MAXMaps routine. It will only appear in the list of maps in the left-hand panel after you have closed and re-opened the MAXMaps window. You can then use the menu option “Map > Rename” to add an appropriate name to the map.
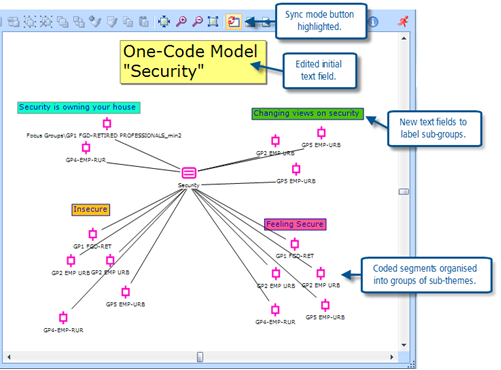
TIP: As an alternative to the method of grouping and labelling shown in Figure 11.2.6 you could create a different layer for each sub-group, each with its own label, then by turning on the base and one layer at a time you could re-examine each sub-group on its own in the map.
There may be occasions when you want to see the text of the coded segments on the map at all times, not just when you hover the mouse pointer on top of one. This has the potential disadvantage of creating more clutter, but it is possible. It is an option on the context menu when you right-click on a text segment object in a map – “Insert text of the coded segment (entire quote)”. These text boxes can then be moved around on the map just like any other object.
The One Case Model
Close MAXMaps and then re-open it and start a new map with the menu option “Map > New model > One-Case Model”. Note that your previous map will be saved and added to the list in the Maps panel when you close the module like this.
The One-Case Model asks you to drag a document from the Document System window onto the new map. This map will focus on that document. The subsequent dialog provides options to select the material to bring on to the map with the document, it is shown in Figure 11.2.7, below.
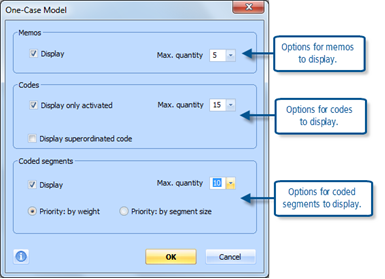
Figure 11.2.7 – A One-Case Model dialog
The initial map will have the document that you dragged onto the map at the centre, with codes and memos that are linked to it arranged in a ring around. The thickness of the lines connecting each code to the document will be proportional to the number of coded segments attached to that code and document; this gives a visual indication of the relevance of that code to this case (if the document at the centre represents a ‘case’ – which is not a correct description of a focus group).
In this model it may be useful to group each code and its related coded segments together before you start moving them around on the map, it will then be possible to move all of those objects together as if they were a single object. In “Select” mode, hold the Shift key pressed down as you click on each object in turn, a pale blue shading box will adjust with each added item until you have included all of them, then click on the “Group objects” button in the toolbar to create the group. Afterwards, when you click anywhere in the area of the map where that group sits, the whole box will be highlighted and you can drag it to any other part of the map and all of its linking lines will adjust for that movement.
TIP: It can be a bit fiddly sometimes to include an item in the group that happens to fall inside the boundaries of the box before you have positively clicked on it to add it to the group. The solution is to add items to the group in a sequence whereby each item remains at least partly outside the box until it is positively added to it.
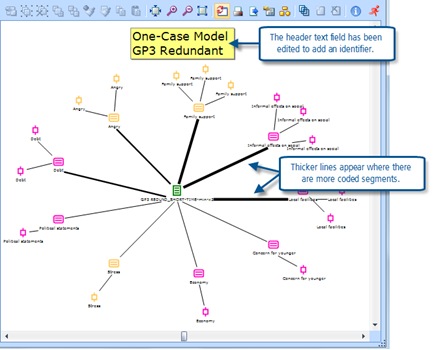
Figure 11.2.8 – An initial One-Case Model map
Now you can move the codes and memos around so that their positions on the map provide an indication of some aspect of your ideas about them. Or you can assign them to separate layers in the map to achieve another visual effect. You can add text fields and edit them to express or label these ideas for future reference.
You will need to switch on “Sync mode” to be able to read the data segments represented by each coded segment symbol, or memo icon. Note that when you click on an object, like a coded segment, then that data will appear highlighted in the Document Browser window (behind the map window) where you can read it in full and in context. Also in Sync mode the document memo will be displayed when you hover the mouse pointer over the document symbol (initially in the centre of the map).
The Code Theory Model
This default model format works with a hierarchical code structure to display part of your coding scheme in a way that facilitates manipulation and re-organisation. It is best to activate the one code group and its sub-groups that you want to map before opening MAXMaps and selecting this new model.
In the “Subcodes” section of the model dialog, note that you can use activation and hierarchical levels independently to select the codes to be displayed. You need to set the level field to a value of at least 1 to get any subcodes displayed (think of the dialog as asking you how many levels of subcodes you want rather than how many levels of codes).
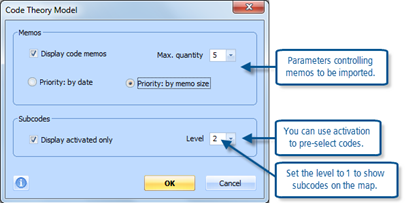
Figure 11.2.9 – Code Theory Model dialog
Figure 11.2.10 shows a simple code theory model based on the “Broad Brush codes” group in our example dataset. Only one level of subcodes existed when this map was created, if there had been any further levels the next one would have been shown as an outer ring of codes in the map.
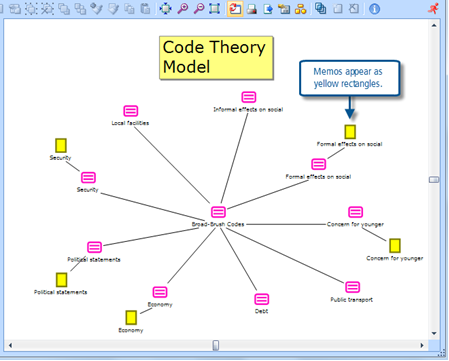
Figure 11.2.10 – Initial Code Theory Model map
When this map was first created some of the memos were in different locations. They have been moved around to shorten their connecting links and thus simplify the map.
TIP: As with the One-Case Model, it would be a good idea to create visual groups for each pair of a code and its code memo before starting to move them around the map as you rethink the structure of this whole set of codes.
The other model templates in MAXMaps
There are two other standard models available through the “Map > New model” sub-menu as shown in Figure 11.2.1. These are best explored for yourself, with the assistance of the MAXMaps help function. For completeness they are listed here as the “Code Co-Occurrence Model” and the “Code-Subcode-Segments Model”. These models will become much more meaningful when you use them with a more richly coded and understood dataset than the one we are using here.
The Code Co-Occurrence Model helps you to examine the intersections between codes. You select a few codes of interest (say 2 or 3) and drag them onto the model, then choose whether to add all coded segments, segments of activated codes only, or coded segments selected by weight scores, that intersect with those initial codes. A possible map to try would be to start with 2 or 3 speaker codes from one focus group and then add all thematic codes that intersect with them to get a picture of what those people spoke about.
The Code-Subcode-Segments Model helps you to look at a group of codes and could be very helpful if you are thinking of re-organising part of your coding schema. You select the header of a group of codes and choose how many sub-codes (via activation) and coded segments to add to the map. With Sync mode turned on you can quickly move from segment to segment, reading each in turn and dragging them into new groupings that might suggest how to re-code the group.
Adding individual objects to maps
The standard models provide a useful starting point to working with maps linked to data in a MAXQDA11 project. But they should not be seen as the end point as well. At any stage it is possible to add single objects from the project to any map, no matter how that map was first created.
There are two ways to add an object from the project to a map that is currently open in the MAXMaps window. The first way is to select the object in whichever window of the main program it is most easily found (a document would be taken from the Document System, a code from the Code System, a coded segment from the Retrieved Segments window, and so on) and then, using the right-click context menu, click on the option “Insert in map”. The second way is indicated by a reminder in that context menu, it is to use the Alt key with a double-click on the required object wherever it is found in the main program.
Objects that are added to a map in this way will appear in the top left corner of the map. They can then be dragged to an appropriate location on the map. To show a link between a newly added object and any other object in the map switch to “Link” mode, select one of the 3 types of link, and click & drag the link between the objects that you want to mark as connected.
Exercises in using maps as part of your interpretive processes
As suggested in the book you could now use some of the models and ideas illustrated above to start to map the processes in your own project.
The standard model templates described above are clearly there to help you complete these tasks. The One-Case Model is a good starting point for mapping an individual case, respondent, or setting (depending on how your data is organised in the Document System). The One-Code Model is a good starting point for looking at an important theme. The Code-Theory Model is a good starting point for visualising your coding scheme (or parts of it). But these are only starting points, a little practice with the basic tools should give you skills that can help you to develop your thinking and ideas far beyond those you can imagine at the beginning.
MAXQDA11 and Case Study B – Exporting MAXMaps
The previous exercises showed you how to create different types of maps in MAXMaps, this section is about exporting and printing a map so that you can use it in other ways beyond the analysis program.
Exporting a map
There will be times when you want to take the work you have done in MAXMaps and export it to another program to integrate it in a report, a poster, or in a presentation. For these purposes MAXQDA allows you to export the graphical map in one of the following picture formats: JPEG, BMP, and EMF.
To export one of the maps you have created earlier you can either use the menu option “Map > Save as picture” or the toolbar button with that label which is located just beside the printer button in the MAXMaps window. As usual you will have to choose a folder where you want to save the picture and give it an appropriate name. There are three different formats from which you can choose in the dialog field “File type”, and so it might be necessary to think about the purpose you need the graphics for. The JPEG format saves all pixels of the map (with 96 dots per inch, dpi) and uses a non loss-free compression method, so it is suitable if you want to use a small map because you won’t be able to scale it up again by very much. A typical map will use round about 1 MB of disk space in JPEG format. The BMP format makes sense if you need a pixel format that can be edited in another program, because it doesn’t use any compression method. This format produces very large files and is not suitable for attaching one to an email. The EMF format is vector based, produces very small file sizes, can be scaled without a limit and may be printed on a poster without any quality problems.
Tip: If you are unsure which format is the best for your needs try the EMF format, which generally works well and can be edited in other programs too.
After you have exported the file you can integrate it in your chosen software, i.e. you can drag the file with the mouse into a MS Word document or a MS PowerPoint document.
Printing a map
On the face of it, printing a map is very straightforward. There is a printer icon on the toolbar (in all 3 working modes) or you can use the menu option “Map > Print”. A dialogue appears where you can set typical options like selecting the printer, the orientation of the printout, and the number of copies. As MAXMaps allows you to create complex graphics there is no (practical) limit for the working space and some of the maps you create may be very large. Please note, that MAXQDA always fits the whole map onto a single page and a huge map may look very small when printed. If you click on the button “Fit to window” MAXQDA displays the whole map on the visible screen where you can inspect the dimensions of the map.
Tip: If you have a PDF printer on your system it may be worth printing a map into a PDF file before you send it to your real printer to check if the printout looks how you would like it to.
Where you go from here is up to you. If you have already ‘organized’ data by assigning variables whether at the Document level or the Code level (some of this was covered in Chap 6 exercises) you could go straight to Chapter 13 - Interrogation.
If however you have not organized data according to known facts like socio demographic variables now might be the time to face up to the task. Next exercises
Graham Hughes and Stefan Radiker 2014
