Using Software in Qualitative Research
A Step-by-Step Guide
Student Resources
Chapter 8 – Retrieval of Coded Data (MAXQDA)
Download the pdf for this chapter guide here.
Chapter 8 in the book focuses on retrieval – a crucial aspect of qualitatively coding data. Yet there are many aspects of this which lead to other things. While looking at one batch of coded data you may want to delve deeper and recode it. There is an aspect of interrogation, using filters to examine particular catchments or subsets of data, cutting data in different ways – vertically in one document or horizontally across all. See all coloured illustrations (from the book) of software tasks and functions, numbered in chapter order.
Sections included in Chapter 8:
Continuity
Horizontal and Vertical cuts
Filtering devices
Recoding
Generating reports
Quantitative outputs
MAXQDA11 and Case Study B – Retrieve coded data within the software
The general principle of data retrieval in MAXQDA11 is to use “activation”, to select the specific documents and codes required, together with a function, to determine how the coded segments are to be combined.
In most cases the retrieved segments will be viewed in the Retrieved Segments window which is normally displayed on the screen beside or below the Document Browser window. Whenever a segment is selected in the Retrieved Segments window it is also immediately displayed, showing its original context, in the Document Browser window.
Within this broad outline there is a lot of scope for variations in the way the retrieved data are presented or viewed, and for different techniques of specifying the particular combinations required.
Retrieve all the data segments for a single code
To display all of the data segments to which a particular code has been attached, all that you generally need to do is to activate all of the documents and activate the code of interest. The data segments will then be displayed in the Retrieved Segments window.
To activate all of the documents you can either use a Ctrl+click on the “Documents” label at the very top of the table in the Document System window, or right-click on that same label and select “Activate all documents” from the top of the context menu that opens.
To activate a single code you can either use a Ctrl+click on its label in the Code System window, or right-click on that same label and select “Activate” from the top of the context menu that opens.
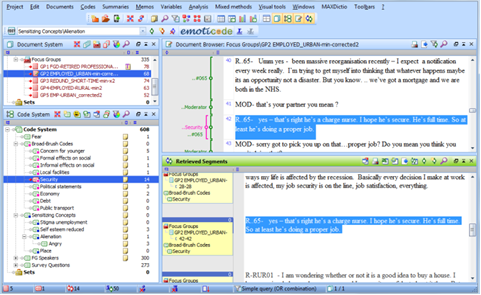
Figure 8.1.1 – Simple Retrieval
In Figure 8.1.1 the result of a simple retrieval is shown. In the Document System window (top left in this illustration) you can see that all of the focus group documents have been activated (by their red colouring), and in the Code System window (bottom left) just the single code “Security” has been activated. In the Retrieved Segments window (bottom right) you can see part of 3 segments (out of 14 in total) and this list can be scrolled up and down to view any of the others. Finally, one segment has been selected in the Retrieved Segments window (with a click on the yellow information box beside it in the margin area) and that segment is also showing in the Document Browser window (top right) with the blue highlight shading – here it can be seen in its full context as that window can be scrolled up and down as necessary. Whenever a different segment is selected in the Retrieved Segments window it will immediately appear also in the Document Browser window.
Note also the information which is displayed in the yellow information box in the Retrieved Segments window, this includes details of the document in which it is found and the code by which it has been retrieved. The number in the blue bar at the top of this information box shows the weighting that has been applied to this code application.
Changing the layout of the MAXQDA11 screen
At this point it may be useful to consider how you can alter the appearance of the working space in MAXQDA11 to facilitate your work.
The window sizes can be adjusted manually by dragging the boundaries that separate the four main elements. The Document System and Code System windows have to share a common width as the vertical boundary in this display is continuous. But the horizontal divider between these windows can be set at a different level to that between the Document Browser and Retrieved Segments windows.
A new feature in this version of the program is a simple way of switching the basic layout of the four windows into different orientations. If the Windows toolbar is visible there is an icon for this, alternatively it can be selected from the menu option “Windows > Screen layout manager”. See figure 8.1.2 for an illustration of this option.
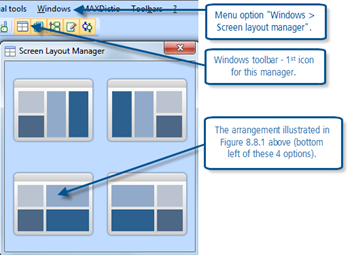
Figure 8.1.2 – Windows Screen Layout Manager
You can change these arrangements around at any stage of your work. Note also that you can switch any of the four windows off, or hide it temporarily, by clicking on the “X” button at the right-hand end of its title bar in order to create more space to view the other windows. When a window has been hidden it can be brought back into view by clicking its icon in the Windows toolbar or using its option in the “Windows” menu.
TIP: If you have a widescreen display, one or other of the upper two arrangements may be useful for viewing the retrieved segments in context with the two text windows side by side.
Retrieve all the data segments for a group of codes
To extend a retrieval to include multiple codes all that is necessary is to activate more codes. This can be done for single codes at a time or whole groups of codes can be activated together. More details about activation routines may be found in a section below.
Overview of Retrieved Segments
An alternative display of the retrieved segments is available by selecting an icon in the header bar of this window. There are in fact two similar displays, one is anchored in the Retrieved Segments window and the other generates a new window floating above it with the normal retrieved segments display still visible behind it.
Figure 8.1.3 illustrates part of the alternative display. The emphasis is more on the technical details of the segments than the actual text or data in them, with a table display in which each segment has a row and the technical data is set out in columns. When a row has been selected the full text of that segment is displayed in a panel at the top of the window, but only one segment can be seen at a time in this format.
An advantage of this particular display is that it is a straightforward matter to add comments to any of the retrieved segments using the fields in the “Comment” column which can be seen in this illustration. Also the segments can be re-sorted into different sequences according to the data in any of the columns. Note the scroll bar along the bottom of the window which can be used to show further data columns to the right.
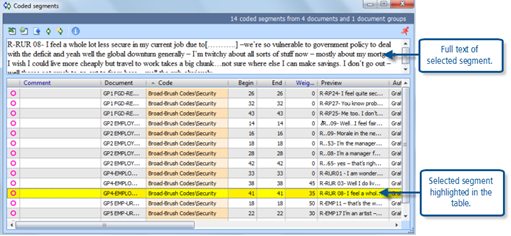
Figure 8.1.3 – Overview of retrieved segments display
Figure 8.1.4 illustrates the toolbar at the top of the Retrieved Segments window. The first icon is the toggle button which switches the display inside the window into and out of the table view. The 6th icon from the left is the button which opens a new window showing the tabular display.

Figure 8.1.4 – Icons in Retrieved Segments toolbar
“Activation”- a reminder
The concept of activation has been described several times in earlier exercises so, if you are already familiar with it, please skip this section.
To activate an item in the Document System you can either use Ctrl+click on its label in the Document System window, or right-click on its label in that window and select the activation option from the context menu that opens. Documents can be activated individually, or in groups depending on where the pointer is located as you make the click. A Ctrl+click on a group header activates the whole group of documents in one go, and similarly a Ctrl+click on the “Documents” header at the top of the list activates all of the documents in the project. If you use the right-click context menu the wording of the option changes between a single document (“Activate”) and a group of documents (“Activate all documents”).
When a document is activated, its icon and name label change to a red colour and a small red arrow appears to its left in the Document System. However you should note that when a group of documents is minimised in the Document System window, so that only the header label is visible (with a “+” box to its left), there is no indication in that part of the screen that those documents are activated – there is an indication in the bottom bar of the MAXQDA11 window where the number of activated documents is shown beside a red document icon in the first field on the left.
Activation of codes in the Code System window is mainly similar to the activation of documents, but there are some differences over the activation of groups of codes. If you right-click on a code label to open the context menu there, you will see two activation options “Activate” and “Activate codes together with subcodes”. A click on the first of these options will activate the selected code. The second of these options has a check-box beside it, and a tick in this box applies to all of the codes that share a group with the selected code. See Figure 8.1.5 for an illustration.
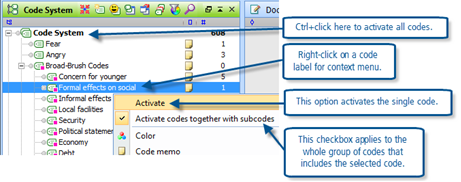
Figure 8.1.5 – Activation options in the Code System window
When the check box for activate codes with subcodes has a tick then activating the group header causes the whole group of codes to be activated together. When it does not have a tick then activating the group header causes that code alone to be activated.
If you have multiple levels of groups in your code system then this gets a little more complicated. Ticking the check box for activating codes together with subcodes for any code at any level within the group applies that setting for the whole group up to the first level. But then activating a header code will cause all of the codes and groups beneath that header to be activated together, but not those at a higher level. In Figure 8.1.5 the subcode “Formal effects on social” has been selected and a tick entered in the check box in its context menu; after this activating the group header “Broad-Brush Codes” will cause all of the codes visible in this image except “Fear” and “Angry” to be activated. Similarly if the tick shown in Figure 8.1.5 were to be removed on any of the subcodes, then afterwards activating the group header would only cause that single code “Broad-Brush Codes” to be activated.
TIP: The best way to learn how this works is to experiment with it yourself.
The opposite of “activation” may be achieved in the same way as activating an element. To “deactivate” a code a second Ctrl+click on the code label will reverse the activation, or the right-click context menu option becomes “Deactivate”.
However, it is sometimes better to use one of the more general “Reset activations” buttons to cancel all activations in a window. In Figure 8.1.5 the icon immediately to the right of the title “Code System” in the green bar is the reset button. There is an equivalent icon in the Document System window, and also a global reset activations button as the 4th from the left in the Standard toolbar at the top of the screen.
Functions used with retrieval
The basic function, which is the default whenever MAXQDA11 is opened, is the “OR combination”. This means that whenever two codes are activated a data segment will be retrieved if it has been coded by one OR the other. When three or more codes are activated this “OR” is extended as many times as necessary and becomes effectively an “any” function, so that a segment will be retrieved if it has been coded with any of the activated codes. This is the most general retrieval requirement, and is also the simplest.
TIP: Note that the bottom bar of the MAXQDA11 window shows the current function setting in its 8th field from the left. Normally this shows “Simple query (OR combination)”. The more complex and sophisticated retrieval functions will be discussed in the exercises attached to Chapter 13. If the field in the bottom bar of the window shows anything other than the OR combination, click on the icon “Reset retrieval functions” which is located in the MAXQDA standard toolbar at the left side.
MAXQDA11 and Case Study B – Generate output reports for retrieved data
The previous exercise demonstrated how simple retrievals of coded data can be displayed on screen in MAXDA11. This exercise shows how such retrievals can be output in a variety of ways to other software programs or to a printer.
The toolbar at the top of the Retrieved Segments window is the key element for these outputs. The contents of the Retrieved Segments window are created in the ways described in the previous exercise and then the output options can be considered. A nice advantage of this way of working is that you can see exactly what output you are generating in the window before committing the output process so you can be confident that you are getting the information that you want.
Figure 8.2.1 shows the Retrieved Segments window toolbar.

Figure 8.2.1 – Retrieved Segments window toolbar
The numbered icons in this toolbar have the following labels:
1. Change to table view
2. Print retrieved segments
3. Show as Excel table
4. Show as HTML table
5. Export retrieved segments
6. Overview of retrieved segments Ctrl + shift + L
The table view is discussed in the previous exercise.
The print option (at number 2 in Figure 8.2.1) has one subsidiary option dialog, the choice is whether to include memos with the coded segments in the print-out. It makes no substantial difference whether the window is in the table view or the normal text view when this output is requested, the print-outs from both views are the same.
When the Excel table button is clicked the program opens MS Excel (or the program associated with *.xls files) and imports the contents of the Retrieved Segments window into it in a single operation. Once again it makes no difference which view is in place when the output is requested. The Excel worksheet has a row for each segment, with columns for details such as the document name and group, the code by which it was retrieved, the full text of the segment, the coder’s name, the date and time when the code was applied, and the paragraph numbers where the segment begins and ends. There is also a column for comments on each segment. Having viewed the data in Excel you can use that program’s “Save as” option to store the file in a location of your choosing.
The HTML table output is very similar to the Excel table, having the same row and column structure and the same details. Obviously this table opens in your default internet browser. The file created by this routine probably goes to the root folder for your documents, you can see its location by checking the web address in the browser window. Again the output is the same whether you were in normal text view or table view when you start the procedure.
TIP: MAXQDA 11 exports all columns that are actually switched on in the table view of the Retrieved Segments window (and also in the Overview of coded segments window). So if you want to adjust the columns to be exported switch them on or off in these windows by right-clicking on a column header and using “Select fields” from the context menu there.
The option to “Export retrieved segments” has a comprehensive dialog which encompasses the previous outputs, ie to Excel or HTML, but this also includes an RTF option and provides an opportunity to select a folder and file name, so this is a more general set of options. See Figure 8.2.2 for an illustration of this dialog.
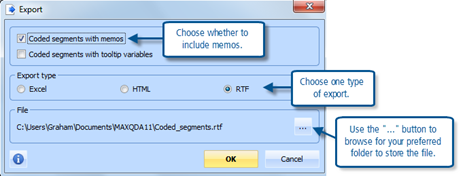
Figure 8.2.2 – Export retrieved segments dialog
Whichever export type you select, the appropriate program will be opened with the exported data as well as storing the file in the folder you have specified. The RTF option will cause MS Word to be opened (if it is available on your computer) with the contents of the Retrieved Segments window in a layout that looks more like the text view of that window, ie one segment after another separated by the document details and any memos/comments.
Smart Publisher
There is another way to export coded segments of data into a word-processed document in an organised way. This is through the option “Project > Reports & Export > Smart Publisher”. This routine is more ambitious and more complex than the simple outputs described above, and has been developed for use at a late stage in a project as a tool to aid the preparation of final reports and publishable papers. It has many more options for creating report headings, page footers and other style settings, and also for selecting which additional details are to be included with each reported segment. It does not work with the Retrieved Segments window but does have an option to limit the data it works with to just activated documents.
This routine will be described in more detail in a later exercise but, if you are of an adventurous disposition, you may care to explore it now as part of learning how to get significant data out of your MAXQDA11 project in other formats.
MAXQDA11 and Case Study B – View all codes appearing in one document
This exercise looks at a variety of ways in which you can examine how codes have been applied to a single document, as a way of interpreting the meanings which you have found in that document.
Margin View
The most obvious way of looking at the codes in a document is the standard view which is always available when the Document Browser window is in use. (Remember that you can switch-off any of the four main working windows by clicking on its icon in the standard toolbar – see Figure 8.3.1 - or in the “Windows” menu, or the “X” button at the right-hand end of its header bar).
Open the document that you want to review by double-clicking on its label in the Document System window (or right-click on that label and use one of the context menu options). If your screen is not very big you may choose to reduce or switch-off the Retrieved Segments window for this phase of work in order to have more space on screen to view the document.
As you scroll down the document in its browser window you should quickly get an impression of the number of codes that have been applied to it through the display of their coloured brackets in the margin to the left of the text. If your understanding of the code labels is limited by their truncation you can make the margin wider by dragging the separator sideways in the bar at the top of the margin (See Figure 8.3.1).
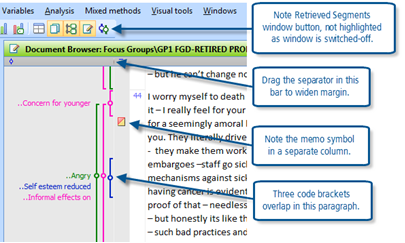
Figure 8.3.1 – Margin for display of code brackets
To see more information about any specific coded segment, hold the mouse pointer over the bracket or its label and observe an information box that only appears while you hold that position. If a comment has been added to a coded segment the circle symbol in the middle of its bracket will be a solid colour, those in Figure 8.3.1 above have an empty disk in the middle which indicates that they do not have comments attached to them. To add a comment to a coded segment, right-click on that segment and select the “Edit comment” option from the context menu. When a comment exists it will be displayed with the other technical information about that segment in the temporary information box.
To see exactly what the limits are of a text segment that has been coded, click once on the code bracket or its label and observe the highlighting (white font on a bright blue background) that appears in the text to the right.
Filtering code displays in the margin
There are several ways in which you can apply filters to the margin display to restrict the number of codes shown or to alter the way in which they are displayed. These all start in the context menu that is displayed when you right-click anywhere in the codes margin of the Document Browser. See Figure 8.3.2 for an illustration of this context menu.
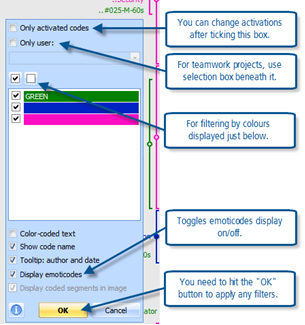
Figure 8.3.2 – Context menu for codes margin – filtering options
You can apply more than one type of filter at the same time, but it would be best to explore these options separately to understand their effects properly.
“Only activated codes” – this option works interactively with the activation settings in the Code System window. If no codes have been activated when you select this option and hit the “OK” button, then all code brackets will disappear from the margin. This gives you the opportunity to bring them back into view bit by bit as you activate more and more codes. Deactivating codes turns their display off again, allowing you to view other codes in isolation. This is the most flexible way of selecting some parts of your coding schema to identify possible patterns in the coded segments and thence by implication in the data.
“Only user” – this option has been provided for teamworking situations where it may be necessary to view the coding work of different analysts in the same data. When you add a tick to the check box beside this option the selection field just beneath it becomes active with a drop-down menu in which to select the user of interest. In this way you can examine the codes that have been applied by any one user in isolation. Leaving this checkbox un-ticked means that all users’ codes will be displayed.
TIP: Even if you are the only analyst working on a project you could make use of this option to distinguish between the open coding and axial coding phases of your work by changing your own user name between these, and then using this filter to display those codes separately.
Colour filters – The colour filter tool works in a fairly intuitive way. All of the colours which have been assigned to codes are listed in the middle part of the context menu with a checkbox beside each. To exclude any colour from the display, simply click away the tick in its box and then hit the “OK” button at the bottom of the dialog. When you have used a lot of colours you may find the two checkboxes at the top of this section more useful, one turns all of the colours on and the other turns them all off; sometimes it is easier to select just the colours that you want from a set of empty boxes, on other occasions it is simpler to remove the few that you want to exclude from a set of ticked boxes. The default setting should usually be to show them all, as is the situation in Figure 8.3.2.
TIP: The colour filters will only be useful if you have used colour consistently to mark some features in your coding system. This can be added or adjusted retrospectively since you can change the colour of each code at any time through the context menu when you right-click on the label in the Code System window.
“Display emoticodes” – If you have used emoticodes as a tool in the early stages of your coding work you may want to hide them in the later stages of the analysis as they can be a distraction with their bright colours and they may only indicate very preliminary ideas. So this option gives you the opportunity to filter that particular type of code application out of view.
TIP: The availability of these filters means that you do not have to delete preliminary coding applications or early work as they become superseded by more advanced understanding. Instead edit their attributes in some way so that you can easily hide them from view for most of the subsequent work while knowing that you can still locate them if need be.
Moving between documents
When you start to make changes to the way codes are displayed in the margin you need to be aware of how these are affected when you open different documents. This is quite easy to test for yourself but it is important to remember in order to avoid misunderstandings later in your work.
Any filters that you have applied as described in the section above will remain effective as you open different documents in the Document System. However if you adjust the width of the code margin in one document this will not carry over to the next one that you open, so each document can have its own margin width appropriate to the density of coding there.
TIP: The filter settings are also saved when you close a project and will be applied the next time you open it, so it may be a good idea to get into the habit of resetting these to their default values at the end of a working session.
Code listings per document
From previous exercises you should be aware that you could obtain a listing of all the codes in one document by activating that single document together with the entire code system using the “OR” combination, and outputting the resulting contents of the Retrieved Segments window. However there is an even simpler way of achieving this result and that is by using a context menu in the Document System window.
Use a right-click on a single document label in the Document System and, from the context menu that opens, select the option “Overview of coded segments”. An example is shown in Figure 8.3.3.
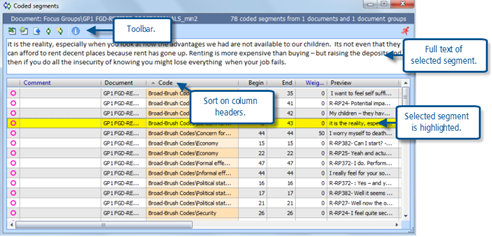
Figure 8.3.3 – Overview of coded segments in one document
By looking at the “Document” column as you scroll down the list of segments in this display you should be able to satisfy yourself that all of the items listed come from the single document with which you started this routine.
As before, with this type of display, you can read the full text of any segment by clicking on it in the list and looking in the larger panel above the listing. You can also re-sort the table on any of the columns by clicking in the header bar at the top of the required column. An obvious starting point for this may be to sort on the “Code” column (as shown in this illustration). This table is interactively linked with the Document Browser window so that you can also see any selected segment in its original context in that window (you may need to move the table window around your screen or re-size it to achieve this). This table provides a convenient opportunity to add comments to the coded segments.
Mapping a coded document
The mapping module in MAXQDA11 is called “MAXMaps” and it is launched with the menu option “Visual tools > MAXMaps” (or with the first icon in the Visual tools toolbar when that has been applied).
MAXMaps seems to be a complex program when first opened but, like so much of MAXQDA11, it soon becomes intuitively easy to work with. It will be discussed in more detail in a later exercise so this is only a brief introduction and step-by-step guide to creating a simple map of the codes applied to a single document.
When you first launch MAXMaps you see an empty window with an unfamiliar toolbar across the top. The upper left portion of this is shown in Figure 8.3.4.
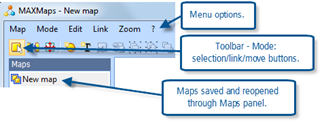
Figure 8.3.4 – MAXMaps intial options
An essential aspect of this module that has to be understood is that it works in three distinct “modes”, and you switch between these with the first three icons on the toolbar. The three modes each have their own selection of toolbar icons, so the rest of the toolbar changes as you move between them.
- In “Selection” mode you add objects to the map and you can move them around within the map
- In “Link” mode you can draw connecting links between objects in the map, to indicate possible relationships, but the objects remain in fixed positions as you do this
- In “Move” mode you can shift the whole map around within the working screen
To create a map to explore all of the codes that have been applied to a single document we will use one of the standard routines in the program that has been designed for this task. All of the menus and options used in the next part of this exercise will be found within the MAXMaps window (which overlays the MAXQDA11 workspace behind it).
- Start in “Selection” mode and use the menu option “Map > New model > One-Case Model” to start the routine
- In the main map panel of the window you will see a header in a yellow shaded box “One case model” and beneath that is an instruction telling you to drag a document into that area. All that you need to do is to manoeuvre the MAXMaps window until you can see the Document System window behind it and then, using the mouse, click on a document that has some coding (here the first focus group transcript will be used) and, holding the mouse button pressed, drag that document onto the MAXMaps window
- A dialog box now opens in the map window with some choices you have to make about the data to be brought into the map. Figure 8.3.5 below shows an illustration with some initial suggested options
The “Codes” section of this dialog is the key item. In these focus group transcripts we have used codes to identify the different speakers, but these will have little analytic value in this particular type of map and so it would be best to exclude them by first activating the codes that we do want to see and then ticking the “Display only activated” box in this dialog. You cannot change the code activations while this dialog is open, so click on the “Cancel” button to close it, set the activations that you want, and start the process again at the beginning.
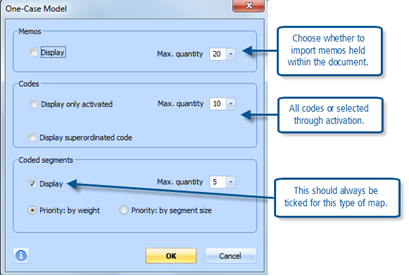
Figure 8.3.5 – One-case model import options in MAXMaps
- When you finally click on the “OK” button in this dialog the map changes significantly. A document symbol appears in the centre to signify the selected transcript and the codes are arranged around it in a star shape, with coded segments linked to each code according to their appearance in the document.
- At first you may not be able to see the whole map, it is probably too large. However you can shrink it with the “-“ icon or its option in the “Zoom” menu, or use the “Fit to window” icon. You can explore the other options in the Zoom menu, which all have buttons on the toolbar in all three modes, and change the size of the whole MAXMaps window by dragging its bottom right corner.
- Make sure that “Sync mode” is switched on. This can be found at menu option “Map > Sync mode”, where you will also see its icon which can be seen in the main toolbar in all three of the main working modes. Sync mode allows the underlying data in the MAXQDA11 project to be seen inside the map. So, with sync mode switched on, when you hold the mouse pointer over a coded segment in the map a temporary information box opens showing the full text of that segment so that you can read it there.
- Note that the lines linking the central document to the code symbols vary in thickness according to the number of segments using each code, darker lines are used for more frequently used codes.
- Switch back to “Selection” mode, where you can experiment with moving the objects around in the map. Simply click on an object and hold the mouse button down while you drag it to a new location. Note how the linking lines adjust to maintain their connections as you move an object. You will probably want to move some items together, such as a code and its attached coded segments. To do this you need to “group” them together in the map. Hold the shift key down as you click on each of the objects that you want to group together, and then click on the “group objects” button (8th from the left in the toolbar when it is in selection mode) to create a shaded box around them all. Now you should be able to drag this group as a single item while its internal links and positions remain stable.
- To save your map in order to look at it again in the future, work in the “Maps” panel on the left side of the MXMaps window. The current map will be at the top of the list called “One-Case Model”. Use a right-click on this label to open a context menu where you will find an option to “Rename” it (see Figure 8.3.6).
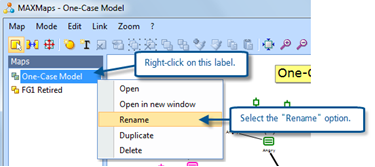
Figure 8.3.6 – Saving a new map
You may find it best to use a significant part of the name of the document around which this model was created in the name for the map. A single document name probably implies that it is a single case model. In this illustration we used “FG1 Retired” for an earlier version of this map and so will use the same name with “v2” added to distinguish it from the previous one.
This is a quick illustration of mapping a single document. Hopefully you have got some idea of how you might use such a tool to think about different codes/themes in a document and how they relate to each other in a visual way. There are lots more aids to your thinking in terms of new objects and text boxes that can be added to a map, different colours and links that can be added and edited, other sorts of data that can be brought in and connected. Eventually the only significant limitation is your own imagination and powers of analysis.
This routine will be described in more detail in a later exercise but, if you are of an adventurous disposition, you may care to explore it now as part of learning how to get significant data out of your MAXQDA11 project in other formats.
MAXQDA11 and Case Study B – Print all codes appearing in one document
Print a document with margin view
It is a very straightforward matter to print a document with its coding brackets in MAXQDA11. There is a printer icon in the toolbar at the head of the Document Browser window. When you click on this a dialog opens asking whether you want to include codes and memos, and it is important that you click on the “Yes” button here for this output. (If you click on “No” your print-out will have the full text but no indication of how it has been coded). This will be followed by a standard printer settings dialog where you can specify the details of your printer if necessary. You can also start this printing operation from the menu option “Documents > Print displayed document”.
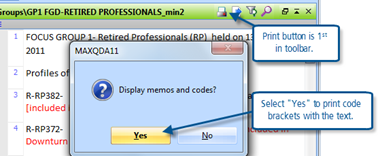
Figure 8.4.1 – Printing a document with code brackets
The print-out should look very similar to the screen display of the entire Document Browser window, with the code brackets appearing in a margin to the left, the memo icons appearing in their narrow margin, then the paragraph numbers in a third margin, and finally the text as the main body of the report. Unlike the screen, there will be no shading behind the code brackets and memo margins. Clearly, the quality of the colours used for the code brackets will depend on the facilities of your printer.
TIP: If you want to send a copy of this print-out to a colleague you could try using an alternative option in the printer settings dialog to print to something like “Microsoft XPS Document Writer” to generate a file that can be opened by a web browser but looks identical to the printed report. This can be very useful for showing your coding work to someone who does not have access to MAXQDA11 themselves.
Note that the second icon in the Document Browser window toolbar has the label “Export displayed document” but this will only export the text and paragraph numbers to an Excel or RTF file, so this is not helpful for reporting on the coding that has been done.
The third icon in this toolbar is an alternative way of opening the dialog to apply filters to the display of code brackets in the margin, this is the same as the context menu that appears when you right-click in the margin. If you apply any filters to restrict the display of certain code brackets before printing the document in the way described above then the print-out will match the screen display and exclude the code brackets that have been filtered-out. Similarly, if you use the facility to highlight all coded segments with the colour of the code applied to it (“color-coded text” in the filter dialog) then a subsequent print-out will do the same.
Report on all codes for one document
In the previous exercise we showed how you can obtain a table that lists all of the codings for a single document by using a right-click on the document label in the Document System window and selecting “Overview of coded segments” from the context menu. There is no print function directly available for this table because it can be so wide that it would be difficult to format. However there are export functions and it seems likely that exporting this table to an Excel spreadsheet should be a good way of selecting the elements of the table that you want to see printed (by deleting or hiding the columns that you do not want to print). It would also be possible to re-order the table by using the sort functions in Excel (for example to sort into groups according to the code names).
If you want to do something similar, but with only some of the codes that have been used in a document, then this can be achieved by activating the required document and codes (or code groups) to bring the coded segments into the Retrieved Segments window and then exporting that data to Excel. For example this would make it simpler to exclude all of the speaker codes in order to concentrate on the thematic codes applied to the focus group transcripts.
MAXQDA11 and Case Study B – Recoding data
There are two distinct types of recoding activity that you may want to use at the level of individual coded segments. Firstly you may want to add another code to an existing coded segment, and secondly you may want to replace one existing code with another applied to the same coded segment. Both of these activities will be discussed with explanations for how this can be done in the Document Browser window and the Retrieved Segments window.
Recoding in the Document Browser window
Adding another code to an existing coded segment in the Document Browser window is even more straightforward than applying the first code was. Simply click on the existing code bracket in the margin to re-select that text segment and then use any of the methods set out in Exercise 5 of Chapter 7 to apply another code. In summary, after reselecting the segment, these methods are:
- Drag it onto the code label in the Code System
- Drag a code from the Code System onto it
- Click on the code button in the code toolbar if the required code is showing there, or use the drop-down menu to select the code and then click on the code button there
- Use the keyboard shortcut Ctrl+Q when the required code is showing in the code toolbar
- Right-click on the code label in the Code System and select “Code” from that context menu
TIP: When you want to do a one-off recode, say because you decide that a mistake has been made and just one segment needs correcting, then methods 1 or 2 above are likely to be the most efficient. But when you want to recode several segments in the same way then it will probably be worth getting the new code showing in the code toolbar and using methods 3 or 4.
To replace one code with another effectively requires the old code to be removed and the new code to be added. But if you think about it the other way around you will find it easier to do. First, add the new code in one of the ways described just above, and then secondly unlink the old code. If you do it this way around you can use the existing code bracket as a quick way of selecting the text segment, but if you unlink the old code first you may have to reselect the text segment before you can apply the new code.
To unlink the old code after applying the new one, right-click on the old code label in the margin and select “Delete” from the bottom of the context menu that opens. Remember that the code label changes colour to black and becomes underlined as you hold the cursor over it, and this will help you to select the correct code to be unlinked.
Recoding in the Retrieved Segments window
It is even easier to recode in the Retrieved Segments window than in the Document Browser, although the principles remain the same.
To select a segment in the Retrieved Segments window just click once on the large yellow information box in the margin beside it and see the whole segment become highlighted.
To add a new code to the highlighted segment click again on the information box and, holding the mouse button down, drag that box onto a new code in Code System window, releasing the button when the required new code is highlighted with a blue background. You will not see a change in the Retrieved Segments window but if you look in the Document Browser window you should be able to see the same text segment already highlighted there and the new code bracket in the margin beside it. You can also use the coding toolbar to add codes to segments selected in the Retrieved Segments window.
To replace the code attached to a segment in the Retrieved Segments window, do the same as before but also hold the Alt key down as you drag the mouse pointer from the information box to the new code. Now when you look at this segment in the Document Browser window you will see that the original code has been removed and the new code has been added. This use of the Alt key is a neat way of effecting such a recode, but this is the only way in which it works at present (using Alt with a click on the code button in the coding toolbar simply adds another code but does not remove the existing one).
Recoding in the Overview of Coded Segments window
In the previous exercise we showed how to obtain a summary of all the codes applied to one document by right-clicking on that document’s label in the Document System window and selecting “Overview of coded segments” from the context menu. This opens a new window on top of the main working screen in which all of the coded segments for that document are listed in tabular format. You can recode segments in this window.
To apply a new code to a coded segment in this window first select the segment by clicking on its row, so that it becomes highlighted in yellow and the full segment appears in the panel in the upper part of this window (it will also be highlighted in blue in the Document Browser window behind it). There are two coding buttons on the toolbar within this window, one for coding with an existing code and the other for coding with a new code.
Before you can apply an existing code to a selected segment you need to make sure that it is available in the quick list, the list of recently ‘used’ codes, which can normally be checked by clicking on the drop-down arrow in the main coding toolbar. However a quick single click in the Code System window on the code that you now want to apply will ensure that it is at the top of the quick list.
Then a click on the green coding icon in the toolbar of the “Overview of coded segments” window will bring up a small autocoding dialog in which you can select the required code (if it is not already showing as the top of the quick list) and hit the “Autocode” button.
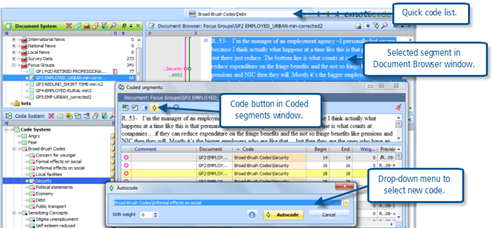
Figure 8.5.1 – Recoding in the Overview of Coded Segments window
If you want to add the same code to several segments in this table you can do this in a single operation. Select the required segments by holding down the Ctrl key as you click on their rows in the table, you should see each become highlighted in yellow. Then use the same coding button on the toolbar in this window, select the required code in the Autocode dialog, and click on the “Autocode” button. The confirmation dialog will tell you how many segments were coded by that operation.
TIP: When you select more than one segment in the Overview of coded segments window you will not see any text displayed in the upper panel of this window, this display only appears when a single segment has been selected.
You can also apply a newly created new code, ie one that you create as part of the coding process, within this window. That is the function of the other coding button in the toolbar at the top of the “Coded segments” window (see Figure 8.5.1). When you click on this button the familiar new code dialog box opens so that you can create the new code, select its colour, and add its memo/definition as additional steps in the process.
Finally, you can also use the same operations as were described above for recoding in the Retrieved Segments window in the Overview of Coded Segments window. So you can drag a selected segment from the overview window onto a code in the Code System window to add that code to it. And, by holding the Alt key pressed as you drag it onto a code in the Code System window, you can replace the previous code with another.
MAXQDA11 and Case Study B – Code frequencies
Viewing code frequencies within MAXQDA11:
The frequency with which each code has been applied is shown all of the time in the Code System window. You have probably intuitively guessed that the numbers appearing beside each code name in that window are the number of times that the code has been applied. If you look at the number beside a particular code immediately before and after applying it to a segment of data in the Document Browser window you should be able to see it increase as part of that operation.
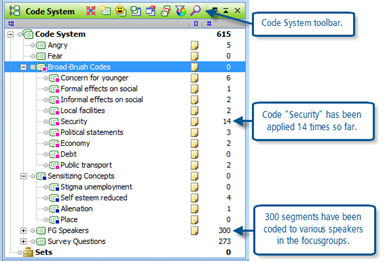
Figure 8.6.1 – Frequencies in the Code System window
The normal display of the Code System, as shown in Figure 8.6.1 above, shows the codes listed in the hierarchical structure which you have created. This does not have to imply any order of precedence or importance between different codes, but it does provide a simple means of organising different types of codes which have different functions. In this project we have used some codes to identify the different speakers in the focus groups, and other codes have been used to identify the responses to the separate questions in the survey data. It is convenient, during thematic analysis of the data, to minimise these groups in the Code System window so that there is more screen space for the codes then being used.
The Code System window can be changed to a table view in order to look at the codes’ data in different ways. The fifth icon from the left in Figure 8.6.1 toggles between the normal view and the table view, and Figure 8.6.2 shows an illustration of this latter view.
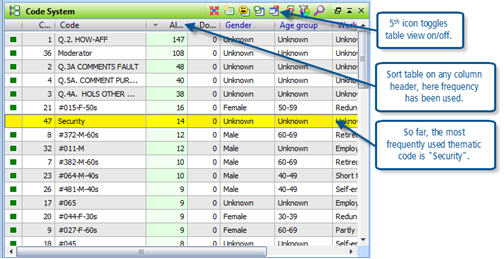
Figure 8.6.2 – Table view of Code System window
In Figure 8.6.2 we have resorted the Code System table by clicking on the third column heading (here seen as “Al…”, an abbreviated form of “All coded segments”) which is the column showing frequencies. In this display it is one of the survey question codes which tops the list with 147 applications, and the most frequently used thematic code at this early stage in the analysis is the code for “Security”.
This table also shows the values for any attribute variables which have been set up for use with codes. This could be a source of confusion at this stage but the variables appearing here only apply to the focus group speaker codes, and they will be used in the exercises in Chapter 12. Where a code variable has no value it appears as “Unknown” in this table. There is no apparent limit to the number of variables that can be used with codes, so this display has a horizontal scroll bar to enable the data in columns further to the right to be viewed.
Using the “Statistic of subcodes” routine
For a more detailed analysis of the coding frequencies within a hierarchical structure of a coding schema you can use the menu option “Codes > Statistic of subcodes”. Note that this also has a short-cut icon on the standard toolbar, and that that icon is shown in the codes menu beside this option.
The first part of this routine asks you to select the code groups which you want to examine. You will only be offered code headings which have sub-codes in the coding schema, so the highest level codes of our case study are not available in this routine, and if you do not have any hierarchy then this routine will not work at all. See Figure 8.6.3 for an illustration of this dialog screen.
Note in Figure 8.6.3 that you have to move code groups from the list in the left-hand panel into the list in the right-hand panel by using the arrow button in the central bar. The left-pointing arrows are for removing code groups from the selected list. In this way you can examine the statistics of several code groups in quick succession.
At the bottom of this dialog there is an option button to select different units of analysis. The default here is to use the number of coded segments, but with this element you can choose to examine frequencies at the level of whole documents. For now leave this box unticked in order to use the coded segment frequencies which are shown in the normal Code System window.
Click “OK” to move to the analysis display.
Figure 8.6.4 shows one of the tables that can be displayed with this routine.
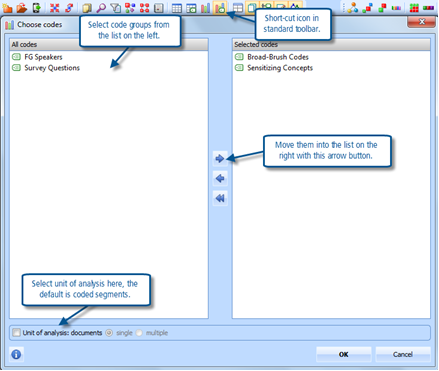
Figure 8.6.3 – Selecting codes for statistical analysis
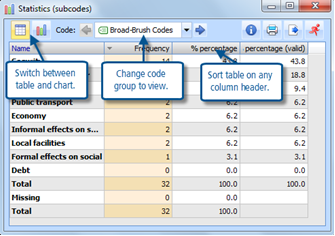
Figure 8.6.4
There are 3 sections in the toolbar along the top of this window. To the left are 2 buttons with which to switch between this table view and the alternative chart view (see Figure 8.6.5). In the middle is a section with which you can look through the different code groups that you selected for inclusion with the previous dialog (here we have just 2 groups) – you can scroll through them in sequence with the sideways arrows or select any one from a drop-down menu list. To the right are buttons for printing the window contents or exporting them to another program (and also a button to open the help function).
Within the table display you can see the list of sub-codes for this group together with basic frequency information and statistics within this group. The table can be re-sorted according to the values in any column by clicking on that column header. Alphabetical order by code name, or frequency order as shown here, are the two most commonly used sorts.
The table is not linked interactively with the Document Browser window so if you want to examine the coded segments that make up a row in the table it will be necessary to retrieve them by activating the appropriate documents and code of interest in the usual way.
To see a graphical representation of the data in the table, click on the chart button near the left of the toolbar. Figure 8.6.5 shows an illustration of such a chart.
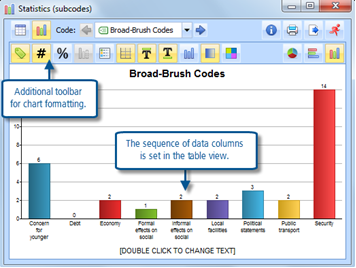
Figure 8.6.5
There are many options for changing the format and style of the chart and these are made available through a second toolbar which appears in this window. Most of these options have more effect on the presentation of the data than they do on your analytical thinking, so they should be considered in the light of how you might use such a chart in a report on your findings. It would be tedious to discuss each of them in detail here, so please explore them for yourself.
Note that if you have selected several code groups at the start of this routine, you can now switch between them in chart view by using the middle section of the upper toolbar.
Exporting code frequency data to other programs
In Chapter 7 Exercise 8 we set out the various options for printing the Code System so these will only be briefly outlined here – for more details on these aspects please refer back to that earlier exercise.
To print the code system with frequencies use the menu option “Codes > Print Code System” – this will give you a report in a list format, with all codes shown in the sequence that they appear in the normal Code System display.
To export the code system to another program use the option “Project > Reports & Export > Code System”. This gives you a further option between Excel and RTF formats. In the context of looking at code frequencies it seems likely that the Excel format will be most useful at this stage. When you initiate this routine a dialog box gives you the option to include the code memos or not, for this illustration we have chosen not to include them. The next dialog is a standard MS Windows “save as” screen in which you have to choose a folder and file name for the output file, (the program usefully remembers the path that you have used for other recent outputs and offers you that, it also defaults to the output routine as the default file name). It is easy to overlook the last field in this screen but this is where you can choose between Excel and Rich Text formats, ie spreadsheet or word-processor layouts.
If you choose the Excel format that program will be opened (if it is available on your computer) and the code system will be laid out with each level of the code system hierarchy in a separate column and the code frequencies in their own column. See Figure 8.6.6 for an illustration.
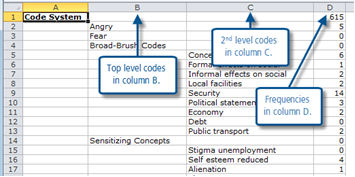
Figure 8.6.6 – MS Excel layout of Code System export
Once the data is in this layout it should be a straightforward matter to re-sort sections of the sheet into order by the frequency column (D) while keeping them within their coding groups (column B). So this becomes a way of examining your coding system in a quantitative way if that is relevant to your analysis method and appropriate for your data.
The CodingScheme
Part of feeling comfortable with the coding process is connected to how you can manipulate the coding scheme or listing; so the next sections and Chapter 9 in the book discuss coding scheme devices and structures which will help to move on in the way you think about the analysis. See next exercises
Graham Hughes and Stephan Radiker 2014
