Using Software in Qualitative Research
A Step-by-Step Guide
Student Resources
Chapter 8 – Coded Retrieval (NVIVO)
Chapter 8 in the book focuses on retrieval – a crucial aspect of qualitatively coding data. Yet there are many aspects of this which lead to other things. While looking at one batch of coded data you may want to delve deeper and recode it. There is an aspect of interrogation, using filters to examine particular catchments or subsets of data, cutting data in different ways – vertically in one document or horizontally across all.
Sections included in Chapter 8
Continuity
Horizontal and Vertical cuts
Filtering devices
Recoding
Generating reports
Quantitative overviews
8.1 RETRIEVAL – VIEWING CODED DATA
- If you need to look vertically through one file at a time, reviewing what you have done open a document and ensure Select Coding stripes /All has been selected – this way, you will see any codes appearing in the data. Though this is not so easy since all codes may occupy a very wide margin space and require much scrolling. Or you can selectively review codes
- Once you have done some coding, you may want to review the passages you have selected for a particular node. To do so, double click on the code you want in the List pane. This will open the code in the Detail pane. Each source that has references to the chosen code is listed, headed by a hyperlink back to the source.

Figure 8.1
The tabs down the side provide different ways to view the references, and are dependent on the type of data media coded there – e.g. a side tab for video would be apparent if video had been coded at ths node.
ANALYSIS COMMENT: There are many reasons why you may wish to see what coding you’ve done, or what content is coded at a node. You may want to review your coding, to compare each passage with the other passages, or to compare with a colleague’s coding (more later on teamwork), or by means of showing Coding stripes to browse what else is coded in this source at that node, or simply to get back to coding where you left off.
8.2. MANIPULATING & PROCESSING RETRIEVAL
Remember that when you are retrieving coded data you are looking horizontally, one code at a time across the whole data set. See Multimedia retrieval below at Section 8.3
8.2.1 CODING-ON OR RECODING
Coding in this window is exactly the same as all the options at your disposal in Chapter 7 sections. Any new coding you do to these coded catchments of data – go to the original document
8.2.2. VIEWING MORE CONTEXT
- It may be useful to be able to see the surrounding context of a coding reference you’re examining. This can be done in several ways:
- You can jump to the source by R-clicking on the passage > Open Referenced Source. This will take you to the source and highlight the passage in which you were interested.
- You can view additional content surrounding your passage of interest without going back to the whole source by R-clicking on the passage > Coding Context > and choosing how much you wish to see.

Figure 8.2
This will bring in your selected quantity in light grey type so you can differentiate it from what’s actually coded at that node at which point you can select more of it to code into that node if you would like.
8.2.2 INCREASING THE AMOUNT OF DATA IN A REFERENCE
If you find that you want to increase the amount of data that a reference contains, highlight the full amount you want and code it per usual. NVivo will combine your previous selection and the new selection into a single reference.
8.2.3. MORE ON CODING STRIPES – WHAT THEY ENABLE
Another way to view what you’ve coded is to use coding stripes. View coding stripes when looking at coded data or when looking at full documents or multimedia files
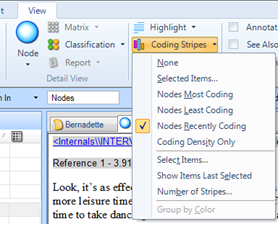
- Turn on stripes by View Ribbon tab >Coding stripes
- Usually choose the Nodes Recently Coding option when actually coding
- To choose which codes you see with stripes in the margin, choose to Select Items… Then you can check off which stripes will appear
- Otherwise, try the other options to see Nodes Most Coding, Nodes Least Coding, Nodes Recently Coding, or Coding Density Only

Figure 8.3
- For the Most Recent, Most or Least Coding options, 7 codes only are displayed, but this can be varied at the Number of stripes option
- Coding Density is a grayscale stripe that will appear with varying shading indicating the number of nodes coding a particular passage. Hover over the stripe to see the names of what nodes are coded there
- If there are nodes not showing that you want to see at a particular point, R-click over the Density stripe in that place > Show stripe > chose the code

Figure 8.4
- Uncode a passage by right clicking on a coloured code stripe>Uncode. This breaks the link between that code and that point in the data
- Use colours assigned when creating codes – View Ribbon tab> change Colour Scheme>Item colours
EDITING NOTE: Having coding stripes showing will make your source Read Only, regardless of whether you previously had the Click to edit option checked.
Also when retrieving coded data in the detail pane you cannot edit the data
8.2.4. REMOVING A CODE FROM DATA
- While you are reviewing coded data, you can remove the code you are viewing from part or whole of a passage by selecting the required bit of text right click and select the Uncode selection> Uncode selection at this node. Quite important to be conscious that you have selected the right one of those 3 uncoding options that appear
- OR a quicker option – Select the bit of data to be uncoded and hit Ctrl F3
8.2.5. EXPORT CODED DATA
There are extensive ways to output data material about your data to other formats and applications. Not all ways are included in this handout since there are infinite combinations of settings required for different reasons which will be based on your own particular requirements.
EXPORTING VIA THE LIST PANE
This is the general and usually used qualitative form of output which can be achieved almost anywhere in the package by different methods. This would usually be what is required for e.g. coded output and is easier to generate than the more formal Reporting functions below.
- In List pane – select the item/s you want to export content for, say a Node or a Document, Right click > Export
IMPORTANT: If you accept the default Entire Content an html file will be created

Figure 8.5
- If you want a Word file or files to be created click on down arrow and select Reference View
- Check any of the additional options carefully e.g. always check the Name option, this will insert the name of the item in the content itself;
- If you use the Annotations tool, always check that option
- If you are uncertain about where the file will go, pay special attention to the File saving window which opens to allow you to create a new folder or to locate the file usefully
- Similarly check the Open on Export option so that you can see the editable file/s you have generated on screen before closing them down
8.2.6. PRINTING
Sources, Nodes, Models etc can be selected in a List Pane and printed from the right click menu.
8.2.7. REPORTS
The formalized Reports and associated Extracts function (in Navigation bar or Explore/Ribbon group) as in NVivo 10 specifically concerns the support provided for mixed qual/quant methods. Some of the reports only provide quantitative information or summaries. Experiment with these via the Help? Menu.
Two standardized Reports will also provide e.g. qualitative coded source data.
- Coding Summary Report by Node
- Coding Summary Report by Source
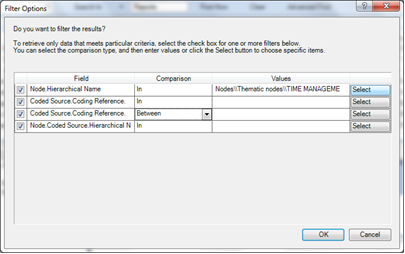
These reports are essentially the same but allow for different sorting mechanisms. This would be a quick way to export many codes at once. Experiment with all the drop-down options and Select buttons.

Figure 8.6
3 .Extracts (filtered summaries of data) can be created (Explore ribbon tab) which can also include coded text
The next sections follow through on ideas raised in Chapter 9 about the coding scheme and how alternative groupings and manipulations of codes can help you move on in the analysis. Either go to multimedia sections below or See next exercises
8.3 EXTRA SECTIONS ON MULTIMEDIA RETRIEVAL
8.3.1 RETRIEVAL OF CODED AUDIO/VIDEO DATA
- Double click on a thematic node as usual – here “Incentives”
- In the side tabs – you will see a number of tabs
- Select the Video tab- and all the coded video files will be iconised along the top (only one in the view below). If there is more than one you can click on the video file icon of your choice
- The coded passages along the play/progress bar are in white. If you hit Play or F7 only the coded segments will play back
- When outputting you can really only output to html format of you want to be able to play back the segments outside NVivo. right click on the node/Export node/Entire content (i.e the default option – an html file will be created)

Figure 8.7
8.3.2. OUTPUT OF CODED VIDEO/SOUND etc.
The nearest form of coded output i.e. getting the coded clips outside the software – is to Export the Entire content (but only play the coded clips) in html format. It is not possible to create a new file containing just coded clips. This would require video editing software inside NVivo and the capability is rarely found in CAQDAS packages.
- Find the node you want to export, right click > Export> Export Node> Entire Content. Ensure you include annotations if you have used that tool to add insights
The next sections follow through on ideas raised in Chapter 9 about the coding scheme and how alternative groupings and manipulations of codes can help you move on in the analysis. See next exercises
Ann Lewins, Christina Silver and Jen Patashnick. 2014
