Using Software in Qualitative Research
A Step-by-Step Guide
Chapter 5 – Getting Started
Download the pdf for this chapter guide here.
Also included in this module are step by step tasks and discussions drawn from Chapter 4, & Chapter 12
These modules are about processing Focus Group data and also Survey data (from Excel)
In Chapter 5 to help get you started, we talk about productive things you can do in the early stages of setting up a ‘project’ in software. Experimenting with these processes where relevant in your chosen software will help to become familiar with useful entities in the software. Chapter 4 is all about getting data ready for the software especially since the preparation of structured data (as with focus groups) can comprise optimizing text for auto coding. Chapter 12 discusses the process of data organization – the attachment of e.g. socio demographic variables – see also later in this module. See all coloured illustrations (from the book) of software tasks and functions, numbered in chapter order.
Sections included in Chapter 5
Creating the software project
Transparency
Getting organized
Importing data
Cross referencing
Literature management
A framework of memos
Create a new project in ATLAS.ti
- Open the software by finding the ATLAS.ti icon or finding Scientific Software in All Programs
- The software will open straight into a New Project (look along top left of software)
- Save the project /File/ Save – name the project
- If you need to go straight to the sections on Importing Survey data click here
You can proceed in many directions from here – but creating memos which will help to signpost direction and track your progress may be a useful exercise.
Create a Research Process Journal or Log
See more detail on these processes in Chapter 10 sections on managing interpretations
- From the Memos main menu/ Create new Free memo /Overwrite the ME..date with a useful name
- Thereafter you can see and open the list of memos and each memo via the Memo Manager – click on the ‘Memos’ button as above

- Experiment with changing the ‘Type’ of the memo – this will help you sort your memos usefully – exporting or printing all memos of a particular type because they can be listed together
Before importing data it would be useful in the case of focus groups to think about how you will be able to auto code data if it is formatted correctly for the respective software.
Chapter 4 is all about getting data ready for the software especially since the preparation of structured data (as with focus groups) can comprise various ways of optimizing text for auto coding in a number of software applications. Minimal guidelines are included which help pave the way for subsequent quick respective changes to text that can be made with the use of Find and Replace tools in Word.
- Open ATLAS.ti and save your project: Project / Save
- Enter a file name like Case B focus group analysis and click on the Save button
In the next step we prepare a memo that contains all the main themes mentioned in the 5 transcripts:
- From the main menu select Memos/Create free memo
- Into the name field, enter code list. Click Enter or ok
- The memo editor opens. Cut and paste the list of major themes from the Word documents into the memo. Enter one code per line. Add the section headers as codes as well. They can remain within the body of the focus group transcript
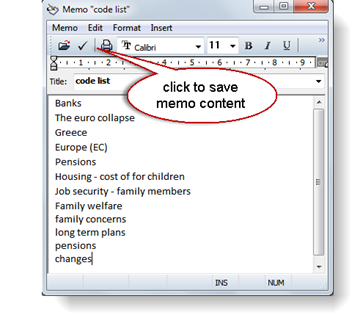
- When you are finished to enter all major theme and section codes (pay attention to duplicates), save the code list memo by clicking on the check mark (see fig x above)
- Close the memo editor
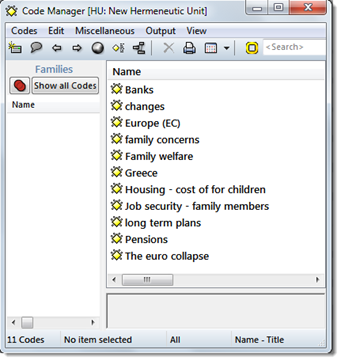
- Open the Memo Manager by clicking on the Memo button (or select Memos / Memo Manager)
- Select the code list memo. From the Memo Manager’s menu select Miscellaneous / Create Codes from Selected Memo
ATLAS.ti informs you how many codes have been imported
- Click on the Codes button to open the Code Manager to review the list of imported codes. Save your project file
Importing the data
Now we are ready to import the data into the project. If you work in a team, import the data into the team library; if you work on your own, use My Library.
- Select Documents / New / Add Documents (My or Team Library)
- Select to the folder where the documents are stored select the documents and click on the open button
TIP: For the process of importing, it is recommended to either store the original data source files locally on your computer or on a server. Clouds are storage spaces but at the same time applications are run on them to synchronize data across different spaces. As this process can change the data source files, good advice is to stay away from drop boxes when preparing an ATLAS.ti project. You may wonder why this is important as the data are imported into the ATLAS.ti library anyway. If you never have an issue with your project (no hard disk failures, computer losses, break downs, etc.), then it does not matter. However, if the need arises to reconstruct your project, you have better chances if you imported data from a non-virtual space. It will also never be an issue if you are good in creating copy bundle files after each work session to back up your project. But…. and the rest is for you to complete.
- Confirm the library that should be used for importing the files.
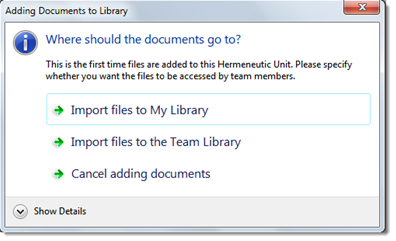
- ATLAS.ti checks all documents for compatibility and informs you how many documents have been imported once the process is completed. Click ok
- Open the fly-out window to review the list of imported documents (see image below)
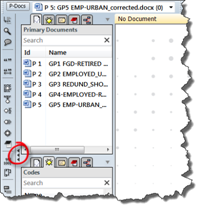
- Double click for instance on P1 (focus group 1) to load it into the HU editor
- Save your project: Project / Save or Ctrl+S
You are now ready to begin coding your focus group data using the auto coding tool and making use of the data which has been formatted in a particular way to enable this. See the next exercise below.
LOOKING AHEAD: Already you have started to consider how the data from individual speakers will be organized in terms of socio demographic variables. Chapter 12 discusses the variety of ways organisation of data can happen, including auto coding and the importance of respective organizing tools to enable different levels and complexity of interrogation.
Sections included in Chapter 12:
- Illustrating the potential for interrogation
- Timing, when to put organisational structures in place
- Organising whole documents
- Organising parts of documents
- Auto coding structures in documents
In order to be able to ask questions like: What did retired people without children say about pensions, as compared to retired people with children, you need to code all responses with the respondent characteristics. This can be done via a combination of text search and automatic coding.
- If you have prepared a list like shown in table x above, you can already enter all codes you need.
As before, you can make use of the option to create codes from a memo. Keep in mind that all codes in ATLAS.ti are sorted in alphabetic order. Therefore it is not a good idea to create a code male and female because the code male will be listed together with other codes starting with the letter m and the code female with other codes starting with the letter f. A better label is Gender: male and Gender: female.
Further, you might consider that you actually want all socioeconomic codes grouped together in the list and you do not want to have them mixed together with your content codes. The alphabetic order sorts codes by special characters, numbers and then letters. Therefore an option is to prefix all socioeconomic codes with a special character as shown in the following list:
#age group: 20-29
#age group: 30-39
#age group: 40-49
#age group: 50-59
#employ stat: employed
#employ stat: part-time
#employ stat: retired
#employ stat: unemployed
#gender: female
#gender: male
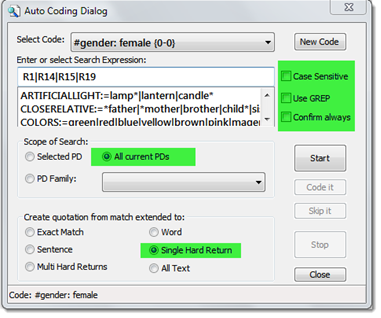
- Open the auto coding tool: Codes / Coding / Auto coding
- Enter a search term (e.g. all IDs of female respondents separated by OR)
- Select the corresponding code
- Select the Scope: All current PDs
- Select the section that should be coded. The option Single Hard Return codes the entire paragraph. This is what we want
- There is no need to confirm each hit if you are sure you created unique respondent IDs.
- Click on the Start button to start the auto coding procedure
ATLAS.ti informs you when the process is finished and how many segments have been coded.
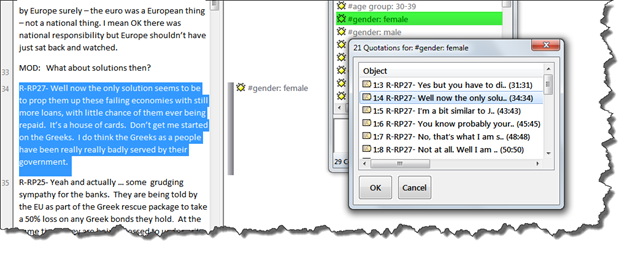
- Open the Code Manager and double check
- Double click the code #Gender: female and select a quotation from the list to see the coded segment in context:
ATLAS.ti allows you to create a new project by importing an Excel file either in xls(x) or csv format. Some formatting rules need to be applied to indicate to ATLAS.ti in which way to import the data. Open ended questions can be turned into pre-coded cases (one primary document per case). Variable type information like gender, age group, profession, marital status, etc. can be turned into primary document families. Thus, you can import a mix of qualitative and quantitative data. The variables (= PD families) can be used for comparison purposes in the analysis. The table below shows how survey items are translated in ATLAS.ti.
|
Survey Concept |
ATLAS.ti Concept |
|
Open-ended question |
Code |
|
Single Choice 0/1 |
PD Family |
|
Single Choice > 2 options |
PD Family from Question plus Value |
|
Multiple Choice |
PD Family from Question plus Value |
Formatting Spreadsheet Data
In spreadsheet programs, you can enter numeric and alpha numeric data as well as dates in the cells of a data grid. To be imported properly in ATLAS.ti the spreadsheet must be formatted so that the columns of the spreadsheet will become variables, while each row will be imported as different cases. The first row should contain the variable names, while the remaining rows should hold the data, one case per row. The following table explains the prefixes
|
Prefix |
Result |
|
! |
This column defines the primary document's name |
|
^ |
This column defines the primary document's author |
|
& |
This column defines the primary document's date, expects ISO8601 format |
|
< |
Ignore this column, use to exclude stuff inserted by the survey tool |
|
. |
Creates a PD family from the field name. Currently the cell needs to contain the number 1, or the words Yes or Ja to be applied. Use for single choice questions where respondents can answer yes or no (or encoded as 1 and 0). Only the responses encoded with yes/ja or 1 become part of the PD family. |
|
: |
PD Family from the field name plus cell value. Use for single choice question like gender. |
|
# |
PD Family from the field name plus the actual cell value. Use for single choice questions with more than two answer options or for multiple choice questions. |
|
|
Add no prefix to all open ended questions. The text in the column header is used as code. To avoid very long code name, use a short form to indicate the question and add the full question as comment (see next row) |
|
:: |
All text entered after two colons is added as comment. This can be applied to cells resulting in PD families or codes. |
The following table is an excerpt from the Case B sample data prepared for ATLAS.ti:
|
!case |
:REGION |
:EMP STAT |
:MARITAL |
:AGE GRP |
|
RESP002 |
RURAL |
RET |
WID |
70-79 |
|
RESP003 |
RURAL |
SELF EMP |
MD |
30-39 |
|
RESP004 |
RURAL |
SELF EMP |
MD |
40-49 |
|
RESP006 |
RURAL |
P-T |
MD |
50-59 |
|
RESP008 |
RURAL |
EMP |
|
30-39 |
|
RESP009 |
URBAN |
RET |
60-69 |
|
|
RESP010 |
URBAN |
RETIRED |
SINGLE |
60-69 |
|
RESP011 |
URBAN |
RET |
WID |
60-69 |
|
RESP012 |
URBAN |
EMPLYD |
MD |
60-69 |
The entries in the first column show up as PD names in ATLAS.ti. All other cells will be turned into PD families, one for each value. In ATLAS.ti, families are like dichotomous variable in 0/1 fashion. The value applies or does not apply. For example for Region, there will be two families
REGION::RURAL
REGION::URBAN
Please note the inconsistent cells marked in yellow and green above for employment status. If you leave it as is, this results in unwanted duplicates:
EMP STAT::EMP
EMP STAT::EMPLYD
EMP STAT: RET
EMP STAT::RETIRED
|
!case |
Q.3A COMMENTS FAULT |
Q.4A. HOLS OTHER COMMENTS |
|
RESP002 |
We've always known about the bonuses, but whats been good about what's happened over the last 2 years? |
|
|
RESP003 |
Pathetic. Unfair. They don’t deserve their money |
We aren't committing to any big things. We will book a late holiday if things are still ok come the summer. Paid for school trips though |
|
RESP004 |
||
|
RESP006 |
I am depressed that I feel we have just accepted it. The ordinary person has no power to change things. Everyone shouts and screams and the taboid rpess make it a big deal but noone can actually do anything |
|
|
RESP008 |
Not the high street banks the investment arms f them. They should be separated. There are safeguards but its panic that is the problem as we saw. There needs to be more confidence n the system |
|
|
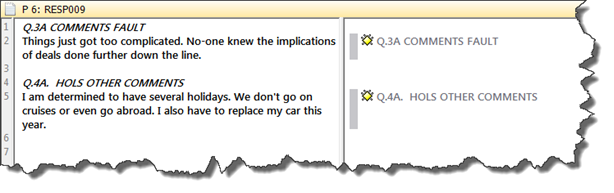
RESP009 |
Things just got too complicated. No-one knew the implications of deals done further down the line. |
I am determined to have several holidays. We don't go on cruises or even go abroad. I also have to replace my car this year. |
Question 3a and 4a are open ended questions. Thus, you do not need to enter a prefix. All spelling mistakes will of course also show up in ATLAS.ti. You can either clean them up beforehand or use the ATLAS.ti edit modus to do so during the process of coding.
The information entered into the first row will be used to pre code all answers. Please note the inconsistency in the above table. The two codes created from the information provided will be:
Q.3A COMMENTS FAULT
Q.4A. HOLS OTHER COMMENTS
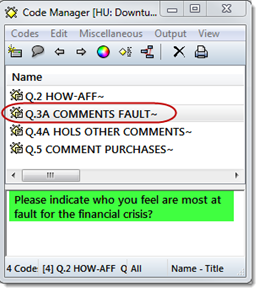
And shown in ATLAS.ti in the following way:
ATLAS.ti can automatically include the full question as code comment. Therefore the recommendation is to pre code the questions either with just the question number, or a question number plus short form for the question, and to include the full question as comment. For this, the full question needs to be entered into the Excel table behind the question number followed by two colons.
|
!case |
Q.3A COMMENTS FAULT::Please indicate who you feel are most at fault for the financial crisis? |
|
RESP002 |
We've always known about the bonuses, but whats been good about what's happened over the last 2 years? |
|
RESP003 |
Pathetic. Unfair. They don’t deserve their money |
|
RESP004 |
Etc. |
In ATLAS.ti this is translated into the following code and code definition:
After you have cleaned up your data and entered the necessary prefixes, mark all cells and format them as text. Next, save the file and close it. If the file is still open in Excel when you import it into ATLAS.ti, it will cause a file violation error. So please remember to close the file in Excel.
Other pitfalls in preparing the file
- Get rid of all fixed rows or columns
- Look for hidden empty columns or rows. This can best be seen if you save the Excel file in csv format and then open it again in Excel
- Special characters in the cells like language specific letters can lead to either truncated quotations or the inability to import the file at all. In such a case, save the file in csv format and try again
To import data based on an Excel spreadsheet
- Start ATLAS.ti and select the option Project / Add Document(s) / Import Survey Data
- Select the Excel spreadsheet and click Open. The import process starts
If you want to import a csv file, select the appropriate file type. ATLAS.ti detects whether it is a comma separated, a semi colon separated or tab-delimited file. Select the suggested option. Proceed to import the file.
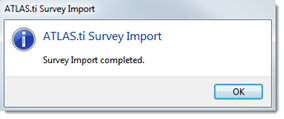
ATLAS.ti informs you if the process is completed
ATLAS.ti creates an internal document per case. This means, all data is contained within the Hermeneutic Unit file. If you add no other documents, the HU contains your entire project and there is no need to create a copy bundle file either as backup or to transfer your project between computers (see ref).
Checking the process – has it worked as you expected?
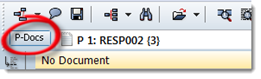
- Open the P-Docs Manager by clicking on the P-Docs button. It shows the list of cases that have been imported, their storage location (in HU) and the document families that have been created.
- Click on one of the respondents in the list. All corresponding document families are immediately highlighted
- Click on a family in the side panel and the list only shows the members of that family, e.g. all retired respondents
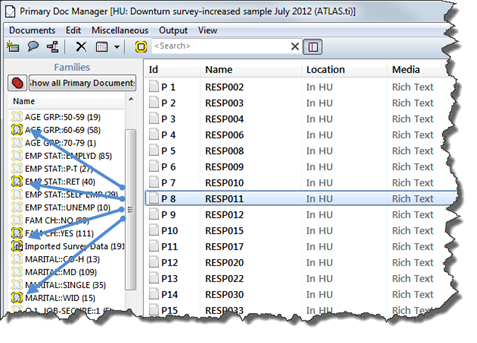
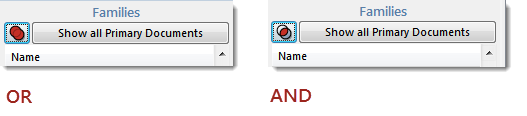
- Click on the Venn diagram, to change from the default OR to AND
- Select two families by holding down the CTRL-key, e.g. EMP STAT::RET and FAM CH::NO. The list only shows 14 respondents – those that are retired and have no children
- Double click on a respondent in the list. This loads the pre-coded answers of this respondent (see image above)
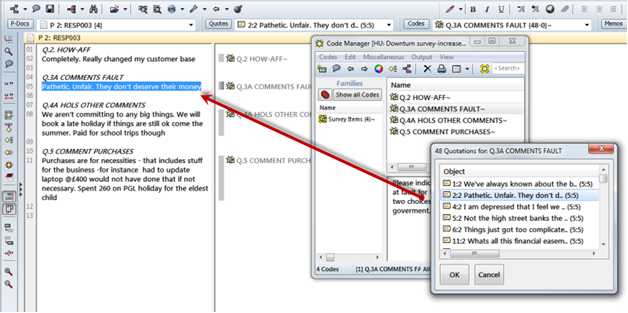
- Click on the Codes button to open the Code Manager
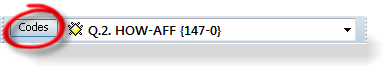
You see the four codes coding the answers to the open ended questions and if you formatted the Excel table accordingly, the full questions in the code comment fields. A code family survey items is automatically created that includes all survey questions.
- Double-click on one of the codes. The list of all pre-coded responses (= quotation) opens
- Select one of the quotations. This loads the document and the selected quotation is highlighted in context