Using Software in Qualitative Research
A Step-by-Step Guide
Chapter 12 - Organization of Data (Dedoose)
Chapter 12 discusses the variety of ways organisation of data can happen and the importance of particular organizing tools to enable different levels and complexity of interrogation. Chapter 6 discussed basic structures like folders which enable simple tidying up and filtering. This chapter takes the subject further and focuses on the need to assign multiple variables, descriptors or attributes to each respondent or case, so that comparing within or across cases can happen via combinations of data and subset characteristics if required. See all coloured illustrations (from the book) of software tasks and functions, numbered in chapter order.
Sections included in the chapter:
Illustrating the potential for interrogation
Timing, when to put organisational structures in place
Organising whole documents
Organising parts of documents
Auto coding structures in documents
One of the most seamless and powerful aspects of Dedoose is capitalized upon by the linking of qualitative resources (and all the subsequent excerpting and tagging/coding of this content) with everything else known about the source of these data. ‘Everything else’ we know is referred to as ‘descriptor’ data in Dedoose. These data can be demographics, survey response, test scores, or any other information that is useful in distinguishing one case in a study from another. When these data are created within or imported to Dedoose and linked to associated qualitative resources, the Dedoose analytic features come alive and allow for a wide range of tabling, charting, mapping, sorting, and filtering based on any of these ‘objects’ in the database.
In Dedoose, ‘Descriptors’ are sets of information you use to identify and describe the sources of your documents (e.g., documents, video, audio, images). Commonly, these are the characteristics of your research participants (e.g., individuals, dyads, families), but can also be descriptions of settings – in which observations are made (e.g., stores, schools, neighborhoods, cultures) – about which you are collecting information.
Click the ‘Descriptors’ icon in the main Dedoose menu bar to define and create descriptor fields and data:
![]()
See the in-depth section of this guide for more on manually building and modifying descriptor sets, but since most users will have these data in a spreadsheet form the importing process follows immediately after the next section on (manually) making descriptors
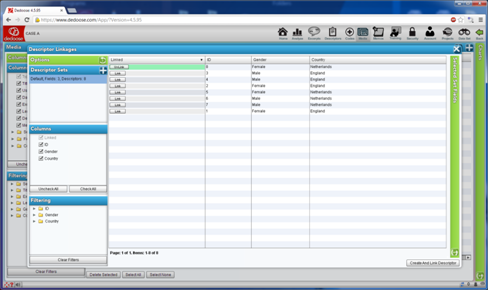
Creating descriptors and linking them to media in Dedoose can be accomplished in a variety of ways. One simple illustration is to do so from the Media Workspace after defining the desired descriptor fields. In this example, fields for ID, gender, and country have been defined. Then from the Media Workspace it is easy to identify which have been linked to descriptors or not as well as the descriptor data themselves.

Clicking on the red descriptors button for the INV-008-NL-F-16.rtf file triggers a descriptor linkages popup where, by using the button in the lower right corner, one can ‘Create and Link’ a new descriptor.

Enter the descriptor data, submit, and you are then presented with a new view showing this newly created descriptor and that the linking was successful.
Close the popup and, with these demographic and any other descriptor data linked to the media, you are prepared to take advantage of the many Dedoose charts, tables, and plots which draw upon these data and all your excerpting and coding of the qualitative media.
There are two steps to importing descriptor definitions and data from Excel into a Dedoose project:
- Prepare and import the descriptor field definitions.
- Prepare and import the descriptor data.
First, field definitions – to import field definitions, the imported data file MUST be structured with the following format
- Descriptor Name
- Memo
- Descriptor Type (Text, Number, Date/Time, or Option List)
- Option List Data (if applicable)…the valid values for categorical fields (ex. for gender, ‘male’ and ‘female’

Example of Format and Column Headers for Importing Descriptor Field Definitions
When ready to import the definitions, click the ![]() (Import Fields) icon at the top of the ‘Set Fields’ panel in the Descriptor Workspace and then follow the prompts to locate the file, open to review, check for errors, and submit to upload and save the information in Dedoose.
(Import Fields) icon at the top of the ‘Set Fields’ panel in the Descriptor Workspace and then follow the prompts to locate the file, open to review, check for errors, and submit to upload and save the information in Dedoose.
Next, to import Descriptor data from an Excel file you must create a file with column headers that correspond exactly to the Descriptor fields that you have defined and then contains all your Descriptor data.

Example of Excel File Format for Importing Descriptor Data
Click the ![]() Import Descriptor Data) button at the top of the ‘Descriptors in Set’ panel in the Descriptors Workspace and follow the prompts to locate, open, review, and submit these data to your project.
Import Descriptor Data) button at the top of the ‘Descriptors in Set’ panel in the Descriptors Workspace and follow the prompts to locate, open, review, and submit these data to your project.
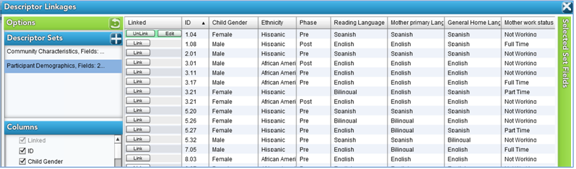
Once descriptor data are in Dedoose, they can, and should, be linked to the qualitative resources with which they are associated. This linking can be accomplished from a variety of locations, but the most transparent is when viewing the qualitative resource itself. Ex. when viewing a document, video, or audio one will see a descriptor button. If the resource is not linked to a descriptor, the button will show a ‘0’ to indicate the resource is not yet linked to any descriptor and will be colored red as a visual cue (see below).
Document Viewing and Linking to Descriptors

Click the red-colored ‘Descriptor’ button in the top-right corner of the document panel (see above) to establish the linking. Again, for Dedoose to generate all the great charts and graphs based on descriptor data and your coding activity, these links need to be established. After clicking this red Descriptor button, you’ll be taken to a list of your descriptor data. Locate and click the ‘Link’ button for the appropriate descriptor, close the descriptor list pop-up, and you are ready to go:
Excerpting, Coding/Tagging, and Dedoose Analytics
Defining and coding excerpts in Dedoose is a simple text-blocking and code-application activity. Very straightforward, as is the case for other qualitative data analysis software packages. The interactive data visualizations built into Dedoose which capitalize on the links between qualitative resource and descriptor data and all the traditional excerpting and coding/tagging activity on these resources is one of the truly unique features of Dedoose.
To take advantage of these analytic features, simply conduct your basic text block, video clip, or audio clip identification, apply whichever codes/tags are appropriate for distinguishing these ‘pieces’ of your qualitative data, and be sure the resources are properly linked to their associated descriptor data and you are ready to take advantage of the Dedoose analytics described in the ‘Interrogating the Dataset, Queries, Searches’ section to follow.