Using Software in Qualitative Research
A Step-by-Step Guide
Student Resources
Chapter 12 – Organizing Data (MAXQDA)
Download the pdf for this chapter guide here.
Chapter 12 discusses the variety of ways organisation of data can happen and the importance of particular organizing tools to enable different levels and complexity of interrogation. Chapter 6 discussed basic structures like folders which enable simple tidying up and filtering. This chapter takes the subject further and focuses on the need to assign multiple variables or attributes to each respondent or case, so that comparing within or across cases can happen via combinations of data and subset characteristics if required. See all coloured illustrations (from the book) of software tasks and functions, numbered in chapter order.
Sections included in the chapter:
Illustrating the potential for interrogation
Timing, when to put organisational structures in place
Organising whole documents
Organising parts of documents
Auto coding structures in documents
MAXQDA11 and Case Study B – Organising data by known characteristics for whole files
In MAXQDA11 the term used for the factual characteristics of cases or respondents is “Variables”. These are accessed from the top bar of menu options or through 4 icons on the standard toolbar (the toolbar icons are displayed in the menu, as can be seen in Figure 12.1.1 below).
There are two types of variable available, document variables and code variables. You should use document variables where a case is represented in your project data by a whole document, such as an interview transcript, so that you can record facts about each respondent such as their gender or age through an appropriate variable. You can then use these variables in subsequent interrogations of your data to separate and compare the data for subgroups of your sample that share values for selected characteristics.
Code variables will be discussed in a separate exercise (Ch12 Ex3), they are useful when you have multiple cases in a document (such as a focus group transcript) and you have used structural codes to identify the contributions made by different speakers for whom you also want to record factual characteristics.
You can create new variables and add values for each case manually within MAXQDA11, or you can import several variables and the values for multiple cases in a special routine if you have this data arranged in a spreadsheet file. This exercise will work through the manual procedure so that you can become familiar with how these variables work before practising a more ambitious import routine in the next exercise.
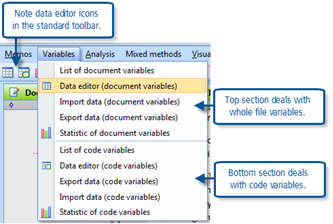
Figure 12.1.1 – Variables menu
Using the document variables windows
Use the menu option “Variables > List of document variables” to open the routine. This opens a window that is illustrated in Figure 12.1.2 below. Here some user-defined variables have been added already (if you have imported the survey data element of this case study into your project you should also have something similar to these variables).
Note in Figure 12.1.2 that some variables have been created by the program, these have a red box in the first column of the table. Any variables created by the user (and that includes those imported as part of the survey data) have a blue box. Each variable has its own row in this window and the columns are used to define various parameters for them.
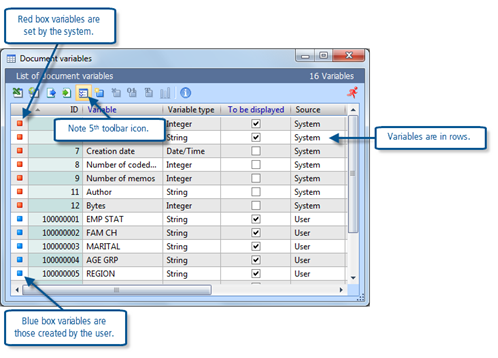
Figure 12.1.2 – List of Document Variables window
Now look at the toolbar in this window and in particular the 5th icon from the left. This toggles between two displays, the list of variables and the data editor. In the list of variables version you can create new variables and adjust the parameters that define them. In the data editor version you can add values for each variable to the cases or respondents. This button has the label “Variable view Ctrl+ O” in both displays but is only highlighted in the list of variables version.
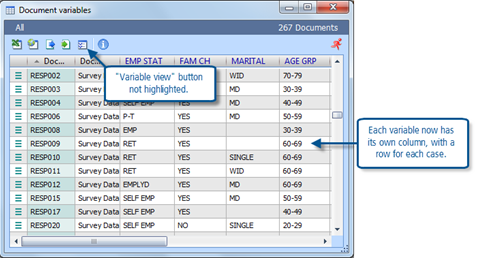
Figure 12.1.3 – Data Editor window
In Figure 12.1.3, above, we have toggled to the Data Editor view of the same window. Now each variable has its own column, and there is a row for every document in the project. For document groups where each document represents a separate case (as in the survey section here) we can meaningfully add or edit the personal data details for such cases in the appropriate cells.
Toggle back to the List of Variables window and look at the column headed “To be displayed”. In Figure 12.1.2 we have removed the ticks in the check boxes for several of the system variables and this has caused them to be removed from the display in Figure 12.1.3 so that we can concentrate on the variables of more immediate interest to us. Remove some ticks from this column in your project and then toggle back to the data editor screen to see the effect. In the data editor version drag the bottom slider to the right in order to see more columns of variables and note how you lose the key respondent identifiers from view; there may be occasions when you will need to hide the display of several user variables in order to work accurately on data in columns further to the right.
TIP: You can also move a variable column from one location in the data editor to another by dragging its header bar with the mouse. This is another way of viewing the document IDs in the same screen as a variable column that is far off to the right – drag the column you want to work on to the left until you can see it in the same screen as the IDs.
Note that you can open the data editor display directly with the menu option “Variables > Data editor (document variables)” (as highlighted in Figure 12.1.1) or its icon on the standard toolbar. This is useful when you want to see the values recorded for a specific respondent. Whichever way you start to work on these document variables you always have the button to toggle between the list of variables and the data editor screens.
TIP: When you have the document variables data editor window open it works interactively with the Document System. So, as you click on a document to open it in the Document Browser, the variable values for that case will be highlighted in the data editor window.
Adding a new variable and its data values
As an exercise let us create a categorical variable for the National News group of documents to identify broadsheet newspapers, tabloid newspapers and the public service broadcaster.
In the Document System minimise all groups except the “National News” one, which should be expanded to show all of its members.
Open the List of Document Variables window (as for Figure 12.1.2). Now click on the 6th icon from the left (which has the label “New variable Ctrl+ N”) – this should be easy to recognise with the gold star indicating a new object routine. This opens a new dialog in which you can define the basic details for the new variable – see Figure 12.1.4 below.
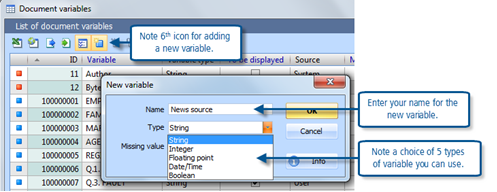
Figure 12.1.4 – New Variable dialog
For this exercise we have added the name “News source” for the variable and we will use the “String” category from the drop-down menu for type. You can add a default missing value for cases where the data is not known, anything you put in this field of the new variable dialog will be recorded for every document in the project until you override it with the known data.
When you click on the “OK” button of the new variable dialog, that variable will be added at the top of the table in the list of variables window, a click in the header field of the ID column will re-sort on those values and the new variable will drop to the bottom of the table.
Now, before toggling over to the data editor view, use the tip mentioned above to temporarily hide the other document variables from the display by removing the ticks from their check boxes in the “To be displayed” column (see Figure 12.1.2 above). Then switch to the window shown in Figure 12.1.5 below. You may need to adjust the column width of the document name column so you can read the newspaper names clearly.
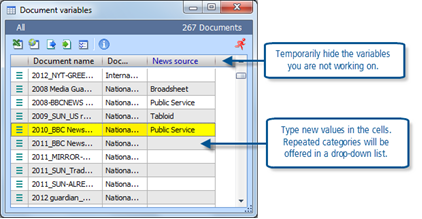
Figure 12.1.5 – Adding variable values
Click the mouse pointer into the cell that represents the first national newspaper and its “News source” variable – the whole row will be highlighted in yellow. That cell will be empty at first, but you can type directly into it with the first data value (here we have used “Broadsheet” as it is the Guardian Newspaper). When you hit the Enter key the cursor will move down to the next cell below in the table ready for you to type the next value. When you start to type a value that already exists in the column above the program will offer you that as an entry from the first letter, hit enter to accept that or continue typing if you need to create a new value that is different. Here, with just 3 values for this variable, we only need to type “b”, “p”, or “t” for each subsequent document once we have entered the values in full for the first time.
For further practice you could create another variable for the newspaper data that holds the year of publication. This information is shown in the document names for all of the newspaper articles but it cannot easily be used to extract data with a time dimension. Make a new variable called “News year” as an integer and categorical variable, then work down all of the newspaper documents in the Data editor typing in the correct year as a 4 digit number (you will find that the predictive entries are no help to you because of the similarity between the different values to be recorded).
Limiting the documents listed in the data editor
You will be aware that it can be frustrating to have to scroll through the long list of all the documents in a project like this case study to record or edit variable values. So it may be useful to know that you can open the variable data editor with just one document group displayed. This is done by starting the procedure from the right-click context menu on the group header for that document group.
Go to the Document System window and make a right-click on the “International News” group header label. Then select the option “Overview of variables” from the context menu that opens. This opens the same data editor as we have just been using, but this time only the documents in the selected group are listed, and the information bar in the window shows “Document Group: International News” where previously it was showing “All”.
Displaying variable values as a “Tooltip”
Sometimes it can be useful to be able to check some variable values quickly while you are working in a document, maybe to see the age of a respondent while you are coding an interview. This can be done by adding such variables to the tooltip box that is always displayed when you hold the mouse pointer over a document label in the Document System.
In the List of variables window there is a system parameter column called “Display as tooltip”. Make a double-click on the checkbox in the row for any variable whose value you want to see so that a tick appears in that box. Then, even with the data editor window closed, when you hover the cursor over a document in the Document System the temporary information box that is displayed there will include that variable value.
Viewing summaries of variable values
A common requirement is to be able to view a frequency table or chart for a variable, and this is very straightforward in MAXQDA11. Use the menu option “Variables > Statistic of document variables” or the toolbar icon which is also displayed beside that menu option (see Figure 12.1.1 above). This opens a dialog where you can select one or more variables to be looked at in this way, see Figure 12.1.6 below for an illustration of this dialog).
Note that selecting several variables merely allows them to be viewed sequentially without revisiting this dialog. The frequency table will show only one variable at a time.
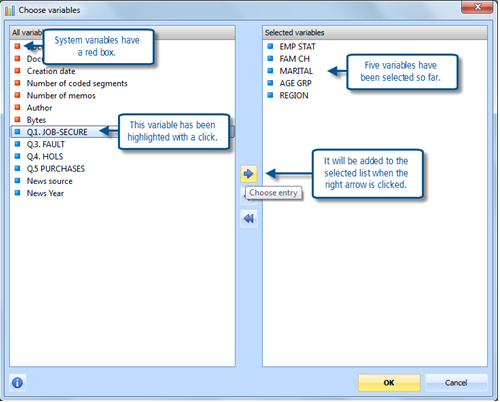
Highlight several variables in the left-hand panel (holding the shift-key down selects a continuous block, with the Ctrl-key you can select separate variables) and then a click on the right arrow in the centre of the dialog moves all the highlighted items into the right-hand panel. Click on “OK” when you have the correct list in the right-hand panel.
The next window to open shows the frequency table for the variable at the top of the list of selected variables from the previous screen. This is illustrated in Figure 12.1.7 below.
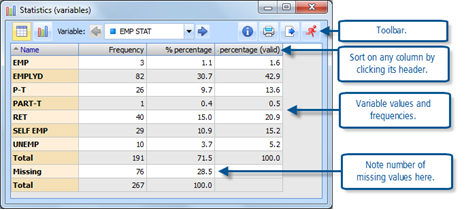
Figure 12.1.7 – Frequency table for a document variable
In the middle of the toolbar is the section where you can scroll through the variables that you selected at the previous stage, or select a particular variable with a drop-down list. Since the first selected variable is displayed here the left arrow is greyed-out. At the left of the toolbar are 2 buttons for switching between the table view and the chart view for this variable. When you switch into chart view the toolbar expands and offers you many different options to tailor the chart format to your own requirements. At the right-hand end of the toolbar there are options to print or export the table.
The data displayed in Figure 12.1.7 is for a variable in the survey data section of this case study, and the frequencies indicate the spread of employment status descriptions amongst the 191 respondents to that part of the data collection process. Note that this table shows 76 missing values for this variable, and these represent the other documents in the Document System such as newspaper articles and focus group transcripts where this variable has no valid meaning. The table column headed “Percentage (valid)” shows the correct proportions for the survey participants. It is possible to remove these missing values by activating the relevant document groups before restarting this routine. When some documents have been activated an additional option appears at the foot of the dialog where you choose the variables to tabulate (it is not shown in Figure 12.1.6) with a checkbox for “Only for activated documents”. In the chart view toolbar there is a button to “Display missing values” and by removing the highlight on that you can hide these from that display.
TIP: If you look closely at Figure 12.1.7 you may notice that there are some minor inconsistencies in the survey data which are apparent in this table. The 3 cases whose status is shown as “EMP” should probably be merged with the 82 who appear as “EMPLYD”, and similarly the 1 at “PART-T” should probably be shown with the 26 at “P-T”. This can be corrected quickly in the Data editor window by sorting that table into alphabetical order on the variable “EMP STAT” and then locating those entries in that listing, or even by using the context menu option “Search” with a right-click on the header field for that variable in the Data editor.
MAXQDA11 and Case Study B – Importing variables in tables
The previous exercise showed how to work with document variables in MAXQDA11 at a basic level. This exercise will show you how to import and export variables data in tabular form. This can be very useful in mixed methods research when you may need to move a lot of data between programs.
Before importing document variables into MAXQDA11 you need to organise them in a spreadsheet with a particular structure. The table should have a row for each document to which the variable values will be attached, and the variables should be arranged in columns with the appropriate value in each cell for that variable and document. The first column of the table should hold the document group name as it appears in the Document System and the second column of the table should have the exact document names as they appear in the Document System. The first row of the table should have the variable names, the name at the top of the first column should be “Document group”, and that at the top of the second column should be “Document name”.
TIP: One way of getting exactly the right document group and document names into the first two columns is to export some existing variable data from the project and then add the new variables to that file before importing it back into the project. The existing variables will not be affected by this process (as long as they are not edited in the spreadsheet).
If you do not have any document groups in your Document System, so all of the documents are held at the highest level there, you can leave the cells in the first column of the table blank but you still need to have the column with its correct header in the table.
The routine for importing document variable data in this way can be found at the menu option “Variables > Import data (document variables)”. This can also be started with the 4th icon on the toolbar of the “List of document variables” or the “Data editor (document variables)” windows. When you start the routine you will see a normal MS Windows navigation dialog for you to identify the source file with the data to be imported. Note that this dialog will allow you to navigate to files of type xls, xlsx, txt, or csv. So this shows the file types you can use to create your import table.
You need to have closed the source file (after editing it) before you can use it in the import routine.
Here is a simple example of this process, using the “National News” group of documents.
- Right-click on the “National News” group header in the Document System and select “Overview of variables” from the context menu
- In the “List of document variables” window that opens (showing just 11 documents) click on the 3rd icon (“Export Ctrl+E”) and save the file in an appropriate location with a name like “Document variables Nat News1” with type Excel
- When MS Excel opens with the table you have just exported, insert a new column between columns B and C for the new variable
- Add your own new variable name in row 1 of the new column, and data values as appropriate in the 11 rows beneath it. A suggestion for this might be a variable called “Politics” with data values “Left”, “Right” or “Neutral” to record the general perceived biases of the different newspapers
- Save the edited file with a different name (say change the final “1” to “2”) and close it
- Back in MAXQDA11, use the 4th icon from the left in the “List of document variables” window to start the import process
- Navigate to the folder where you stored the edited version of the table (ending with “2”) and click on the “Open” button
- You will now see a dialog asking you to select the variables to be imported. This will list all of the variables that you exported but will also have the new variable at the top of the list (or wherever you inserted the new column in the table). See Figure 12.2.1 below for an illustration of this dialog. Untick all of the variables which are not applicable to this group of documents but make sure there is a tick in the checkbox for the new variable(s) you have created
- Click on the “Import” button to complete the procedure
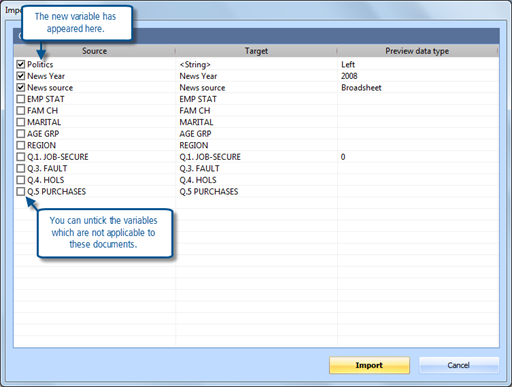
Figure 12.2.1 – Selecting variables to import
The routine will run quickly and then reopen the Data editor window. It will probably revert to showing all of the documents in your project (rather than the single group with which we started) and the new variable will have been added at the extreme right end of the table (not the location implied by the list in Figure 12.2.1). To check your import it may be simplest to close the Data editor window, then reopen it with the context menu for the National News document group so that you only see those 11 documents, and then scroll to the right to find the new variable.
A better way of checking the data import may be to open the “Statistic of document variables” routine from the “Variables” menu (or with its icon on the standard toolbar) and move the new variable into the right-hand panel before hitting the ”OK” button to view its frequency table.
Note that at Step 4 in the procedure outlined above we suggested manually entering the new values into the spreadsheet table. This was to simplify the example and concentrate on the export/import procedures. Where you have substantial volumes of data you would probably look to use an automation process, or at least copy/paste, to bring the new variable data into the spreadsheet table at that stage.
MAXQDA11 and Case Study B – Using code variables for organising data
The previous exercises worked with Document variables, but there is a similar set of routines in MAXQDA11 that work with Code variables. These are particularly useful when you have socio-demographic data about individual focus group speakers as you can use them to differentiate between the contributions to such discussions made by sub-groups of respondents.
This topic was partly covered by the exercise in Chapter 5 called “Adding speaker attributes” in the section headed “Adding attribute data to focus group speaker codes”. Here is a quick summary of that exercise.
- Open a focus group transcript and note the details for all of the speakers taking part
- Create a code group heading for focus group speakers and then a code for each speaker in the transcript. Note that you can include some abbreviated demographic data in such code labels (eg. “#019-M-50s” to indicate that case number 19 is a male aged 50 to 59)
- Use the lexical search function combined with autocoding to locate all of the speeches made by one participant and apply the appropriate speaker code to those paragraphs
- Repeat step 3 for each speaker and focus group in turn
- Open the option “Variables > List of code variables” (note this is in the lower half of the Variables menu) and use the “New variable Ctrl+N” menu option to create 4 new code variables. Name these variables “Gender”, “Age group”, “Work status” and “Job title” respectively and make them all string variables
- Toggle to the “Data editor (code variables)” window (or open it from the “Variables” menu or with its icon in the standard toolbar – note the subtle difference between the menu options and icons for the document variables and code variables) and locate the section where the focus group speaker codes are held
- Use the notes made at step 1 above to enter the appropriate values in the newly created code variables for each focus group speaker. Enter these values directly into the cells in the table, allowing the program to prompt with existing values when they are repeated in the table
TIP: If you already have many thematic codes in place by the time you want to create these code variables you may find it better at step 6 above to close the “List of code variables” window after creating the new codes, and then use the right-click context menu on the header code for the focus group speakers to select “Overview of variables”. This should open the data editor for code variables with just the focus group speaker codes showing, and hence no distractions from the thematic codes for which these variables have no meaning.
MAXQDA11 and Case Study B – Using “Activation by variables” for filtering data
The previous exercises in this chapter have shown you how to create and apply variables to documents and codes. This exercise will show you how to use those variables to filter the data that you retrieve with reference to those variables.
Activating documents by variables
In many projects you will collect data through interviewing individual respondents and analyse those transcripts in separate documents. If you apply the respondents’ socio-demographic details to the interview documents as variables you can then use those variables to separate the males from the females, or different age groups etc. In the example project we do not have individual interview data of that kind so we will illustrate this process with the national news group of documents, and also with the survey data.
In the first exercise of this chapter we created two new variables for the national newspapers, one categorising them between broadsheets, tabloids and public service, and another recording the year of publication for the article. We can now use the data in these variables for filtering this group of documents.
In the Document System toolbar click on the 4th icon from the left, with the label “Activate by document variable”, as shown in Figure 12.4.1 below. This routine can also be started from the context menu that opens with a right-click on the main “Documents” group at the very top of the Document System, where the icon is also shown.
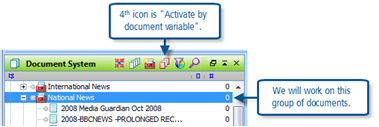
Figure 12.4.1 – Document System toolbar
This opens a dialog window for setting the filtering parameters, as shown in Figure 12.4.2 below.
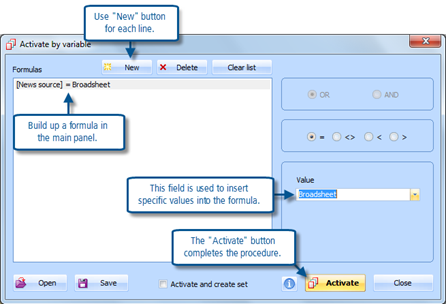
Figure 12.4.2 – Creating a formula for filtering
It is possible to create complicated multi-part parameters here but to begin with you should use a simple selection criterion. In this illustration we have set the parameter as “[News source] = Broadsheet” so that only the documents matching that value will be activated.
When you first open this dialog it may show the formula that was used the last time, so you will need to remove that with the “Clear list” button at the top of the window. This should give you an empty panel in the formulas part of the window. Now click on the “New” button to start a new formula line. This opens another dialog where you can select the variable to use, as shown in Figure 12.4.3 below.
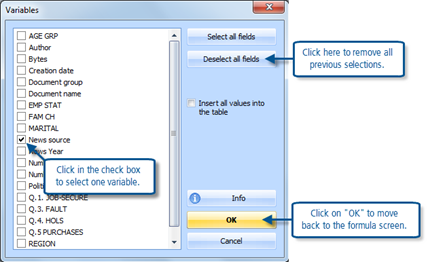
Figure 12.4.3 – Selecting a variable for the formula
Again, a previous selection may be showing so you can use the button to the right labelled “Deselect all fields” to clear that. Then click in the check box beside the variable you want to use in the formula, here it is “News source”, and then click on “OK” to go back to the formula screen.
TIP: Note that both user-defined and system variables are available for selection here, this may become useful for sophisticated filters. Also, for this sort of filter you should ignore the field “Insert all values into the table” as that is not what we need, this same dialog is used for other queries in the program.
Back in the main formula screen you should now see the first part of the formula has been created, as shown in Figure 12.4.4 below.

Figure 12.4.4 – Partly created formula
Now turn your attention to the section on the right of this dialog labelled “Value”, as shown in Figure 12.4.5 below.
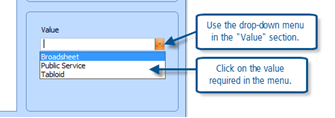
Figure 12.4.5 – Selecting the required value to complete the formula
Click on the drop-down arrow to open the menu from which you can select the appropriate value for the “News source” variable. Note that this value menu will always show the range of values you have created for the variable selected at the previous step. Here we have chosen the value “Broadsheet” and that will appear in the field when it is clicked. At that point it will also be inserted in the formula to complete that as shown at Figure 12.4.2 above.
You can now click on the “Activate” button to apply the formula and function to the document system. Figure 12.4.6 shows the result in our example project data.
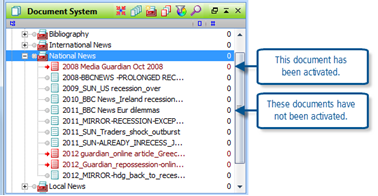
Figure 12.4.6 – The result of applying an activation by variable formula
Note how 3 documents in the National News group have been activated while the remaining 8 have not. We could now go on to activate one or more thematic codes and examine how the texts retrieved differ from the texts when the tabloid papers are activated with the same codes. In this way you can begin to think about how different sub-groups in your data have expressed related ideas.
You may think that this effect could have been achieved more directly by simply activating each of the “Guardian” documents with Ctrl+click, but the process can be extended to much more complicated combinations of variable values by building more sophisticated formulae in the main dialog. You can add more lines for further criteria and you then have to choose whether to apply them with the “AND” or the “OR” parameter. You also have the choice between “=”, “<>” (not equals), “<”, or “>” for each value. Figure 12.4.7 shows an example of a three part formula and its result in the Document System.
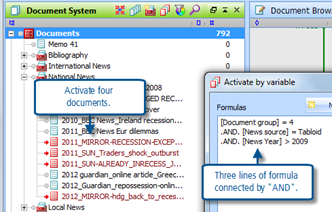
TIP: When you use a system variable like “[Document group]” in the formula you have to select its value from a numerical list, the numbers represent the order in which the groups were first created so here “National News” was the 4th document group to be created in this project.
The power of this function may be more readily appreciated when you apply it to the “Survey Data” document group. Here there are 191 documents and 9 different variables, and so there is considerable scope for activating subgroups of the data according to different combinations of variable values. But really it is only when you work with your own data that you will appreciate the value of being able to think about subgroups separately in this way.
Note also that you have buttons at the bottom of the formula dialog window where you can save or re-open previously saved activation formulae. So you can store a complicated activation formula for re-use rather than having to recreate it at a later date. For commonly used subgroups of the document system you can click on the check box labelled “Activate and create set”; this will make a new set at the bottom of your Document System with all of the documents activated by this formula, which you can later use by simply making a Ctrl+click on that set header.
TIP: When using these activation by variable formulae it is a good idea to check the result numerically by looking at the first field in the status bar at the bottom of the MAXQDA11 working screen, this shows the number of documents currently activated beside a red document icon. Also when changing between different activation formulae it is a good idea to use the “Reset activations” button in the Document System toolbar to clear one formula completely before starting the next.
Activating Codes by Variables
In the example project we have shown how you can use structural codes to identify the contributions made by each individual speaker in the focus group session. We have also applied some variables to those speaker codes, and we can now use a similar procedure to the one demonstrated above to activate subgroups of focus group speakers according to those variable values.
As a first step in using the code variables as a means of organising data, we will use the routine “Activate by code variables”. This routine can be started from an icon on the toolbar in the Code System window – see Figure 12.4.8 – or from the context menu that opens when you right-click on the main “Code System” header at the top of the list in the Code System window, where the icon is also displayed.

Figure 12.4.8 – Activate by code variable
This routine opens a dialog where you can set the parameters for this activation. Any previously used parameters will be visible when you open this dialog so you will often need to use the “Delete” or “Clear list” buttons at the top of the window before starting a new selection. When you hit the “New” button a second dialog opens on top of the first for you to choose a variable by putting a tick in its check box. In Figure 12.4.9 this is shown with the variable “Job title” selected.
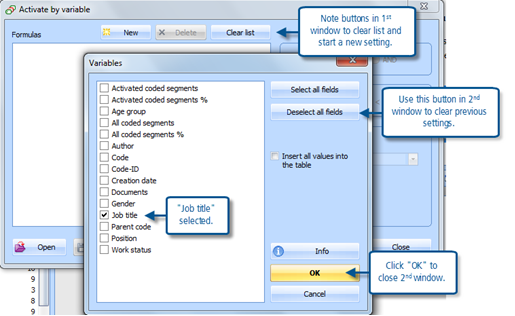
Figure 12.4.9 – Parameters for activation by code variable.
After selecting one relevant variable in this way, click on the “OK” button to close the variable selection window and return to the main dialog. A partial formula will now have appeared in the main panel of this dialog “[Job title] = “. You now need to complete the formula by selecting a value from the list of possible values for the chosen variable which can be seen with the help of a drop-down menu on the right (see Figure 12.4.10).
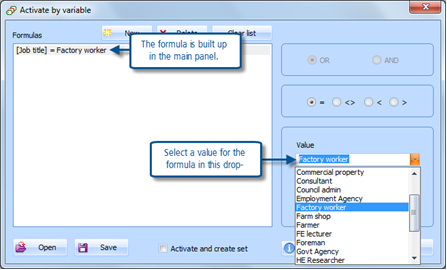
Figure 12.4.10 – Completing the activation formula
Here we have chosen the value “Factory worker” to complete the formula. When the “Activate” button is pressed the routine will work to activate all codes which have values matching the formula. In this case this is just 2 codes, those for speakers #010 and #011.
To see any texts we also need to activate some documents, so activate all of the focus group documents with a Ctrl+click on the header for that group in the Document System. This identifies 14 segments and brings them into the Retrieved Segments window, where we can read everything that was said by factory workers in these focus group sessions.
A closer look at the dialog box where the formula is built-up shows that you can make very complicated activation formulae. You can create as many lines as you want using one or more variables, connected with “AND” or “OR” functions, and you can use 4 comparative functions to apply values for the selected variables (equals, not equals, less than, or greater than). You can save such complicated formulae for re-use later in the analysis, and you can save a particular activation as a “Set” in the Code System (so that you can activate that particular set of codes with a simple Ctrl+click at any subsequent time).
TIP: When using these activation by code variable formulae it is a good idea to check the result numerically by looking at the status bar at the bottom of the MAXQDA11 working screen, this shows the number of codes currently activated beside a red codes icon. Also, when changing between different activation formulae it is a good idea to use the “Reset activations” button in the Code System toolbar to clear the effects of one formula completely before starting the next.
You only organize data to this extent so that you can interrogate across and within cases, subsets and using a combination of variables. See next exercises from Chapter 13
Grahma Hughes and Stefan Radiker 2014
