Chapter 8 – Retrieving Coded Data (HyperResearch)

Download the pdf for this chapter guide here.

Chapter 8 in the book focuses on retrieval – a crucial aspect and outcome of qualitatively coding data; there are many aspects of this which lead to other things. While looking at one batch of coded data you may want to delve deeper and recode it. There is an aspect of interrogation, using filters to examine particular catchments or subsets of data, cutting data in different ways – vertically in one document or horizontally across all. See all coloured illustrations (from the book) of software tasks and functions, numbered in chapter order.

Sections included in Chapter 8

Continuity

Horizontal and Vertical cuts

Filtering devices

Recoding

Generating reports

Quantitative outputs 

Exercises: basic retrieval of coded data 

Generating Reports

When you choose Tools Report Builder, HyperRESEARCH displays the Report Builder window. Here you can specify the report settings.

HyperResearch image

Choosing what to include

Your report can include information about each code reference, information about the study as a whole, or both.
You can limit the report to specific code references by filtering codes and cases, or by specifying one or more source types under Only Source Type.

Including code references

If you check any combination of the boxes in the Code Reference Elements to Include section, your report will include information about each code reference, similar to the information in the list of code references in your study window. You specify which information to include using the boxes. (For specific information about each checkbox, see the Report Builder topic.)

Including study information

The checkboxes in the Study Overview section let you include information about the study in your report. You can include lists of cases, codes, sources, or filtering criteria.

The Study Overview lists appear at the beginning of the report, before the code reference information.

Reporting on a subset of your study

Your report will include information on the codes and cases currently filtered (visible) in the study. You can use this feature to create reports on selected subsets of your study data. See the Filtering Cases and Filtering and Sorting Code References topics for more information about filtering.

TIP: To create a report on all cases and codes, first make sure to choose Cases > Filter Cases > All Cases and also choose Codes> Filter Codes >All Codes. This clears all filters and shows all your codes and cases, allowing them all to be included in reports.

Specifying source types

These checkboxes let you specify which sources you wish to include in the report. By default, code references to text, image, and movie or audio sources is included, but theme codes – created by the Theory Builder – are not.

The Coded Source Text checkbox (under Code Reference Elements to Include) lets you include source data for text files, but not for other data types. Movies, pictures, and audio are not displayed in reports, even if you check the Coded Source Text box.

Sorting code reference information

You can sort the code reference information into sections, either by Case Name or by Code. Each section of the code references includes all the references for a case or code. The case name or code appears at the start of each section.

Masking confidential data

If your study contains confidential information that should not be shared with the recipients of your report (for example, if the report will be published or made available on a public web site), you can redact particular words or phrases. When the report is generated, these words and phrases will be replaced by whatever you specify. (For more information about ensuring the security of confidential data, see Backing Up and Securing Data.)

To mask data, click the Mask Confidential Data button in the Report Builder window. The Mask dialog box appears.

Enter a word or phrase that you want to redact from the report on the left, and enter whatever you want to replace it with on the right.

To mask more phrases, click the button to the right of a row to add another row below it. To remove a row, click the – button next to the row.

TIP: To avoid having to re-enter your masked data and replacement data, click Export to export your list of masked data to a text file. The next time you create a report, click Mask Confidential Data, then click the Import button to re-use your exported mask data.

When you export or display the report, the confidential data you entered will be removed, replaced by the substitute data.

Important! Masking data affects only the report, not the study file or source files. The study and source files remain unchanged, and the information is masked only in the report.

Displaying the report

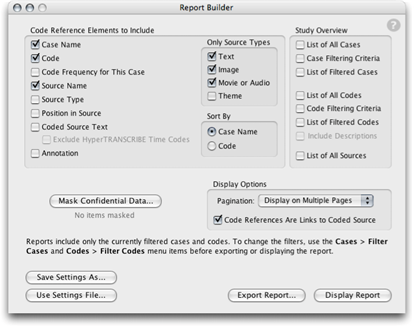
Once you’ve entered your settings, click Display Report to inspect the report. The report appears in the Display Results window.

HyperResearch image

HyperResearch image

If you aren’t satisfied with the results, change the settings in the Report Builder window and click Display Report again. The new report is displayed.

Navigating through a displayed report

If you chose “Display on multiple pages” from the Pagination popup menu, each section – case name or code name, depending on the Sort By option you chose – appears on a different page of the report. If you also chose options under Study Overview, these lists appear on the first page, before the code reference information.

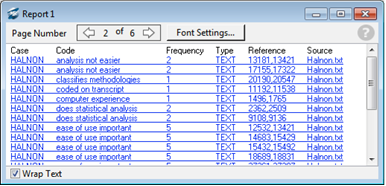
To move between pages, use the arrows at the top of the Display Results window.

Using report links

If you chose the Code References Are Links to Coded Source option in the Report Builder, each code reference in the displayed report is a link, and appears in blue underlined text. Click any link to open the source file and display the coded text for the code reference you clicked. (This does the same thing as clicking the code reference in the study window with the View Source box checked.)

Exporting or printing the report

Once you are satisfied with the report, you can either print it, or export it for further formatting (or to include it in another document.

To print the report, choose File Print (with the Display Results window frontmost).
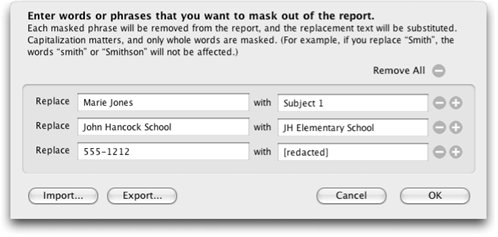
To export the report as a text file, click Export Report in the Report Builder window, then choose a name and location for the file. The report is saved in a plain text file.

Code references in an exported report are separated by returns, and the case, code name, code type, and so on are separated by tabs. If you open this file in a spreadsheet program, the codes and descriptions are in separate columns, and each code reference is in a separate row, with each column in a separate column of the spreadsheet.

Saving and re-using report settings

If your settings are complex, you may prefer to store them for later rather than re-entering them every time you You can save the report settings by clicking Save Settings As. This button saves all settings that appear in the Report Builder window in a text file.

You can re-use the same report settings at a later time by clicking Use Settings File and selecting the saved report file. This will change the options in the Report Builder to match the settings you saved.

NOTE: Saving the settings file does not save the report data, only the settings. If you make changes to the study file, then open the settings file with Load Settings and create a report, the new report will include the additional data you added to the study file.

Saving filters along with report settings

If the Save Case and Code Filters option in the Reports tab of the Options/Preferences window is checked, saving settings also saves the currently filtered cases and codes. Likewise, if the option is checked when you use the Load Settings button to restore your settings, the code and case filters will also be restored. 

If you want to use just the report settings without restoring any filters at the same time, uncheck this option in the Options/Preferences window before you click Load Settings.

Saving mask information

When you save report settings, any masking data you have entered in the Mask Confidential Data dialog box is not saved with the report settings. To save masking data, you must use the Export button in the Mask Confidential Data dialog box instead.

For more information and step by step instructions for using the Report Builder, see Tutorial Four: Analyzing Codes and Reporting in the Documentation folder installed with HyperRESEARCH.

Recoding data

Please see the Chapter 9 Exercises for information on using HyperRESEARCH's Rename, Re-Code, and Duplicate commands in recoding your data.

The Frequency Report Window

The Frequency Report window creates a summary of how often your codes have been used in the study. In the Frequency Report window, you specify what information will be included in the report.

To open the Frequency Report window, choose Tools > Frequency Report.

The frequency report lists all the codes in the Code Book, along with the total number of times each code has been used in your study.

The checkboxes in the Frequency Report window allow you to include additional information about each code. Each option is displayed in its own column in the frequency report. You can display the following optional information about each code, along with the total:

Minimum: The smallest number of times that the code has been used in any case in your study. (If there are any cases in your study where the code has not been used, the minimum for that code is zero.)

Maximum: The largest number of times that the code has been used in any case in your study

Mean: The average (arithmetic mean) number of times the code is used per case

Standard Deviation: The standard deviation of the distribution of codes across the cases

Bar Graph: A horizontal bar that’s proportional to the total number of times the code has been used in your study. (This is the same information as in the Total column, presented in visual format to make it easier to scan.)

Under Codes and Cases to Include, you can specify whether to report on all codes and cases, or only the codes and cases that are currently filtered. (For more about code and case filters, see the topics Filtering Cases and Filtering and Sorting Code References.)

As you change the options you want, the updated report is shown in the window.

Click the header of any column (except the bar graph) to sort the report by that column. (By default, the report is sorted by code name.)

HyperResearch image

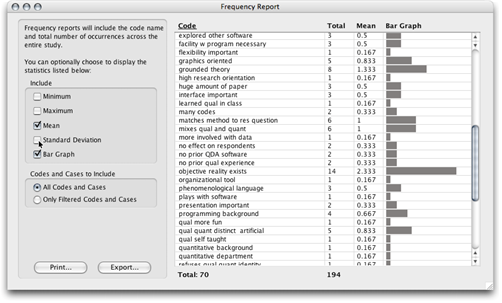
The total number of codes shown, and the total number of uses of all codes (that is, the number of code references in your study) are displayed at the bottom of the window.

The Export button offers two options: you can export the frequency report or export a code frequency matrix. Both options save the data in a plain text file whose name you enter. Columns are separated by tabs, and each code is on a separate line. You can open this file in a text editor, word processor, or spreadsheet application for formatting or further work.

The Print button prints the frequency report.

Also See in HyperRESEARCH Help

These topics in the HyperRESEARCH Help and the User Guide may be helpful in completing the exercises for this chapter:

  • Analysis: Filtering Cases, Filtering and Sorting Code References, Analyzing Code Frequencies
  • Reporting: Generating Reports, Printing, Exporting Study Data
  • Windows: Report Builder, Frequency Report window, Display Results window
  • Tools: Report Builder

To find a topic, choose Help > HyperRESEARCH Help and look through the list on the left side of the Help window.

Part of refining ones ideas about the data may also be to do with changing the way you list or view codes – see Chapter 9 and related exercises to explore this further

Ann Dupuis 2014