Using Software in Qualitative Research
A Step-by-Step Guide
Chapter 12 – Organizing Data (NVivo)
Chapter 12 discusses the variety of ways organisation of data can happen and the importance of particular organizing tools to enable different levels and complexity of interrogation. Chapter 6 discussed basic structures like folders which enable simple tidying up and filtering. This chapter takes the subject further and focuses on the need to assign multiple variables or attributes to each respondent or case, so that comparing within or across cases can happen via combinations of data and subset characteristics if required.
Sections included in the chapter:
Illustrating the potential for interrogation
Timing, when to put organisational structures in place
Organising whole documents
Organising parts of documents
Auto coding structures in documents
This section only deals with the organisation of primary data – see a short section at the end which discusses the organisation of e.g. literature
Organizing data using NVivo’s most efficient method for doing so is not the easiest process to absorb and get right. We all the methods (and state their shortcomings if there are any, so that you can make the right choice for your data). Some of the methods you may already be using. We strongly advise you to follow the logic of all the advice below in sequence.
Some questions first.
1.Do you have a very homogenous data set with not many differences in respondent type or socio demographic characteristics are not relevant?
If the answer is YES you can ignore the more complex options for data organisation and possibly focus on the simpler options.
2.Do you have too much information i.e. complex facts, features and information to keep in your head when it will come to interrogating and comparing across and within different files and cases?
If the answer is YES, you probably need to make a choice from the more complex methods of data organisation
12.1.1. SIMPLER METHODS OF DATA ORGANISATION
Folders or Sets
What they can do
You may already have organised you source files in folders – these can act as a filtering device when doing later Queries ‘Items in Selected Folder’ using the query tool – similarly Sets (if you have sources there) can acts as an ‘Selected item’ to filter to.

Figure 12.1
What Folders and Sets can’t do
They can’t be combined to create more complex scoping for a query. Multiple folders cannot be searched ‘across’ - i.e. to produce an easy cross tabulation matrix style output in one query. (Though you can do separate queries to build up a sense of comparison).
12.1.2 MORE COMPLEX METHODS OF ORGANISATION
Creating nodes to represent and code respondents/cases/other units of analysis
If the answer to the second question above was YES and you do have a complex dataset with many socio-demographic or other information to keep in mind about your respondents/cases then you need to create Nodes which act as structural nodes representing for your individual respondents or the other units of analysis you are dealing with. Not all your files will be about people. Sometimes nodes will be needed to represent observations, field notes, or material about studies or places.
Once you have done this (however you do it see below at section 12.2) It enables several possibilities for you straightaway.
A. Where a file consists of more than one case you can use the code/node applied to each case to view just that case (say one speaker from a focus group)
B. You can combine/copy/merge those case type nodes into another node based on a socio demographic characteristic (and so on with other socio demographic values) female, male, OR female of 20-29yrs old etc. use this rather than the below option only if you really do not understand option C. All your queries will use combinations of nodes codes rather than any other entities of organisation (or combined with folders)
C. Use another entity the Node Classification = most efficient and INSTEAD OF POINT B. ABOVE, more difficult to grasp but more efficient: Link the (structural) nodes e.g. for each respondent to a Node Classification (usually only one, but depends on the spread of data and different elements of the research project). The Node Classification enables any number of attributes to be created below it…and that is how socio demographics are assigned i.e. to each Node but via its link the Node Classification . This is enabled via nodes representing and applied to all the data for each e.g. person or case respectively. See Figure 12.2 below
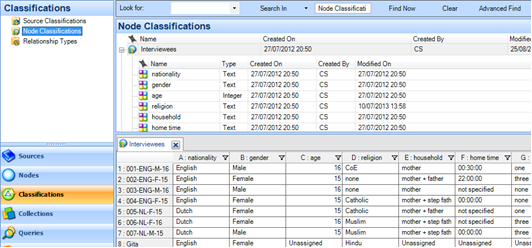
Figure 12.2
Remember that Folders contain the actual items, whereas Sets contain short-cuts to Nodes and Sources - So an item like a source document should only belong in one Folder but the same item can belong in multiple Sets. Items can be added to or removed from folders and setsd at any stage of your work.
For reminders on how to create Folders go to 5.3.7
For reminders on how to create Sets go to 9.2.4
The summary of the process sequence
1.Make the node classification
2.Create one or two attributes under the classification (just to try it out)
3.Make a folder for the new structural nodes (case or respondent type nodes)
4. Make the nodes
5.Link the nodes to the classification
The full process
12.3.1. MAKE A NODE CLASSIFICATION
Be in the Classsifications function (see Navigation bar) Create/Node Classification see Figure 12.2. below.
TIP: you only need more than one classification if you really have different data for which VERY different attributes are needed . Usually one will do and you can just have as many attributes underneath it as you might require to organise all the different data.

Figure 12.2
NOTE: There are few advantages in using the predefined classifications in this case
12.3.2. CREATE ATTRIBUTES AND VALUES
To add Attributes to a Classification, first, locate the Classification in the List Pane. Then:

Figure 12.3
- R-click on the name of the Classification (‘Interviewees’, in the picture here)
- Select an Attribute Type from the menu (text, integer, etc.).
- NOTE: Your choice of text versus an Integer (number)
- Using a Number Type value is critical if you have an Attribute whose values are numerical and you intend to query the data based on terms such as “greater than” or “less than”. NVivo recognizes that “3 > 2”, for example, but does not know that “three > two”. Additionally, NVivo cannot order ranges (e.g., 20-29, 30-39) because it recognizes them as textual, not numeric. If your data contains ranges you will want to order, it is advisable to convert it to a number for purposes of the Attribute and Values. You may choose, for example, to enter the range 20-29 as 25, 30-39 becomes 35, etc.

Figure 12.4
- Click on the Value tab (shown left)
- Enter relevant values using the ‘Add’ button. (Male and female, in this example). Each separate Value should occupy one line in this table
- Click ‘Ok’ when finished
12.3.3 MAKE A FOLDER FOR YOUR RESPONDENT /CASE NODES
- Be in the Nodes function (see Navgiation ane) right click create new folder – call it CASE NODES or PEOPLE NODES or RESPONDENTS (it doesn’t really matter what you call these entities like this Nodes folder or the Classification – they are purely structural…as long as you understand what they are for (that’s the tricky bit!)

Figure 12.5
12.3.4 CREATE NODES AND APPLY THEM
What sort of units of analysis have you got?
A Do your source files each represent one case/respondent?
B OR are there multiple cases/respondents in each file?
A. Source files representing one case/respondent
See the Figure 12.6 as you follow these steps:
1.In the Sources List Pane, highlight all the Sources from which you want to make Respondent Nodes. (These could be all the one-on-one interviews, for example.)
2.R-click over the selected Sources and choose Create As / Create As Case Nodes
3.In the Select Location dialogue, choose the Node folder into which you want the new Nodes to go (in this example, ‘Respondents’)
4.In the lower part of the dialogue, choose the appropriate Classification to which to assign the resultant Nodes (in this example, ‘Interviewees’)
5.Click OK
6.If you’ve inadvertently skipped step 4: locate the Nodes you’ve just made in the Nodes folder, select them, right click on top of them, and choose Classification

Figure 12.6
7. If you now find your Node Classification – right click and open it – there will now be a table that appears in the detail pane, allowing you to assign values in relevant cells
8. Hover your cursor over a cell, click on the down arrow and either reveal the drop down of values you have already made – or select the Unassigned value – and type a new value over it

Figure 12.7
B. Are there multiple cases/respondents in each file?
You can choose to code the speaker sections by hand if you need to – or you can use the auto coding tool if you have identified and entered speakers or relevant sub-titles appropriately AND have formatted correctly using consistent heading level styles– see Chapter 4-5 LINK TO CHAP 5 N2
Autocoding for structure within Sources (e.g., speaker sections in focus group data)
With focus group data, you might want to autocode your data to compare responses of different participants. Similar to autocoding individual interviews, make sure that you have properly formatted documents (ex., Heading 1 for topic area and Heading 2 for speaker sections – or a another, different pair of heading levels will do) prior to autocoding. (If your data is not properly formatted, remember that you can always code for speakers “manually”: create a Node for each speaker and, in turn, find and code each contribution by each speaker.)
TO AUTOCODE
- Go to Sources and click on the folder that contains the focus group documents
- In the List Pane, select the documents for autocoding by holding Ctrl and left clicking
- Go to the Analyze Tab and select ‘Autocode’. A window appears where you can specify your auto coding criteria. As above, it is set to Paragraph Style
- Choose the headings you want to auto code
- Click Select to change the Location to Nodes\Respondents (this is the folder we created earlier)
- Click OK

Figure 12.9
- You can view all of each speaker’s contributions separately by double-clicking to open a speaker Node. Additionally, now that you have a Node for respondents, you can link them to an appropriate Classification…
- Select all the Nodes – right click / Classification> Choose relevant classification as below Interviewees

Figure 12.10
- Apply relevant Attributes by following the process described above at section 12.3.4. and Figure 12.7. These processes together enable interrogation of the data on the basis of Attributes or cross tabulation type queries of codes by attributes
In Chapter 13, we follow up on what we have enabled here to discuss data interrogation and the discussion in the book covers various special types of query – including Matrix codiing queries in NVivo. See Chapter 13 exercises